


 15 / 36

15
Position paper - CenSES 1/2015
3.1.2. Energy consumption
The residential energy service demand is analysed with TIMES-Norway resulting in a demand of energy carriers
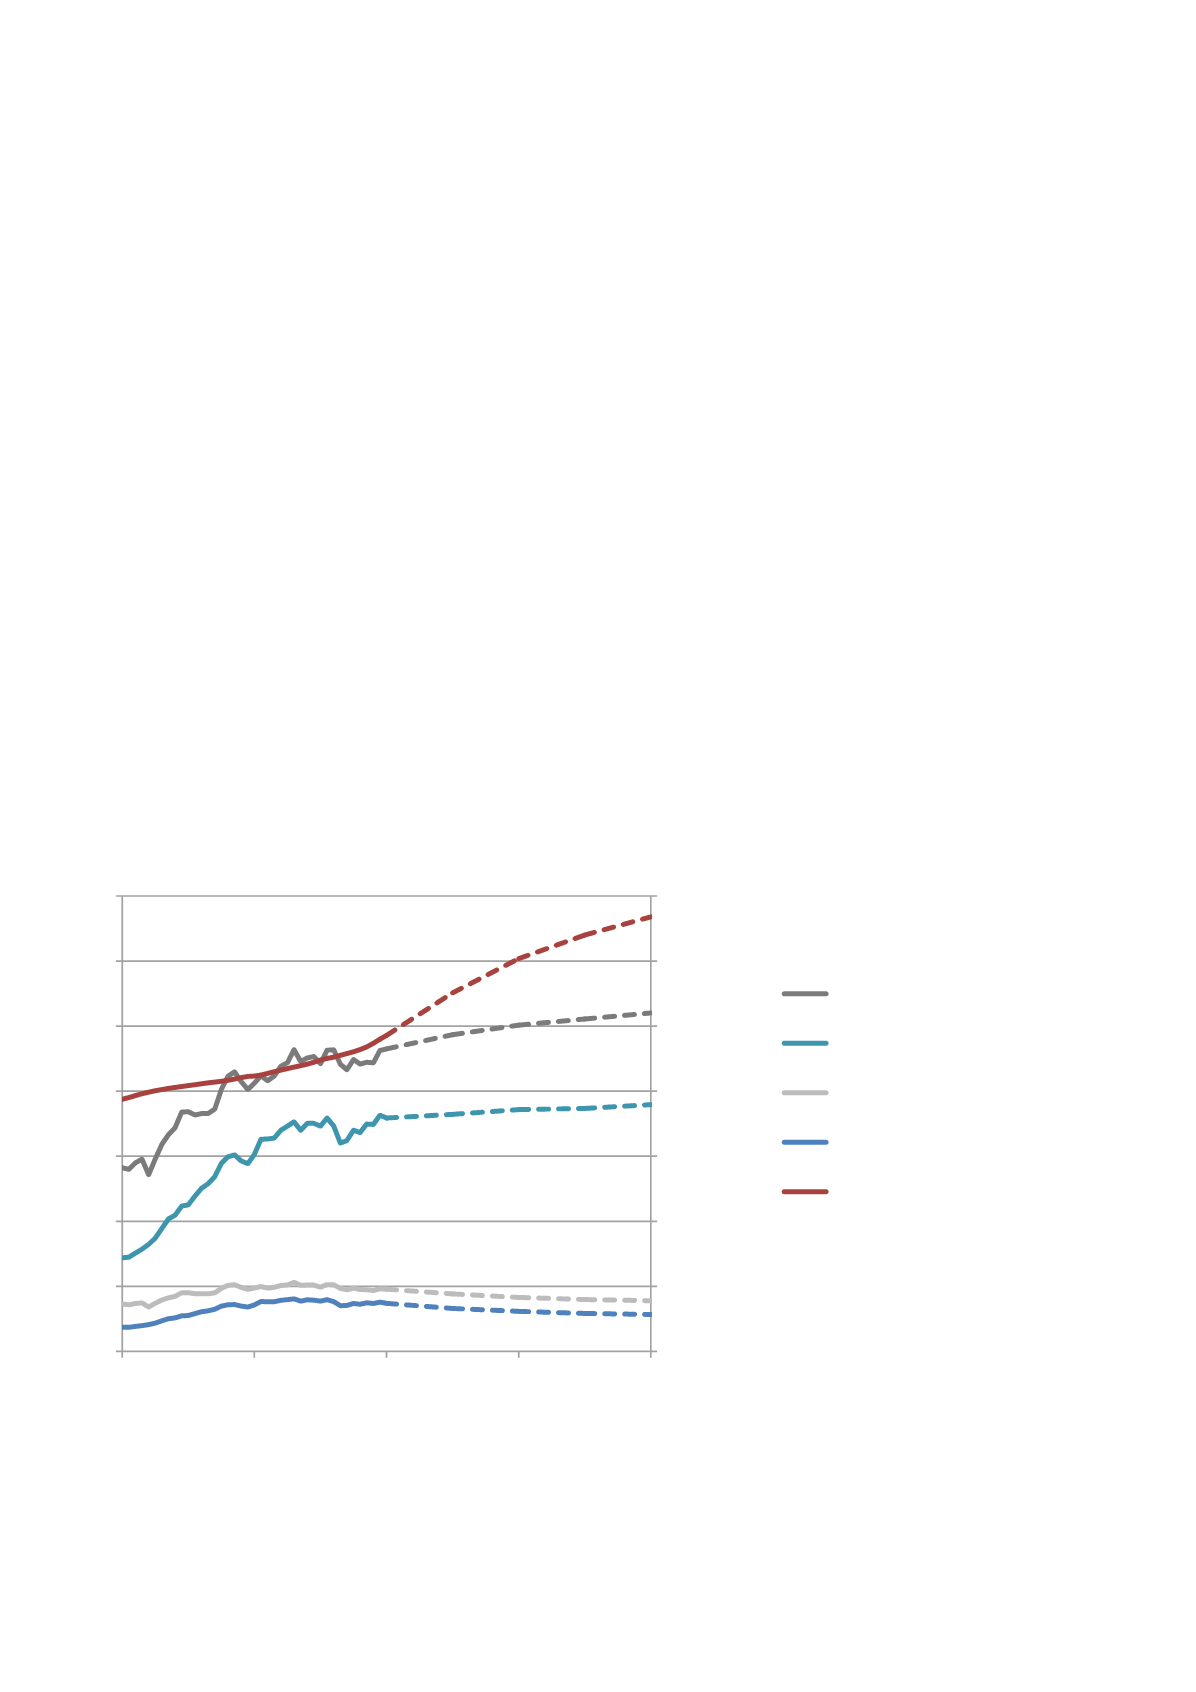
and use of different end use technologies. The energy consumption is calculated to 52 TWh in 2050 and of this
38 TWh is electricity in the reference path. The development of total energy as well as electricity from 1970 to
2012 (statistics) compared to projected future energy use to 2050 is presented in Figure 8 [10]. Due to the strong
increase in population, both total energy and electricity use increase slightly, but less than the population growth.
The indicators “energy use per person” and “electricity use per person” both decrease more than the past years.
Both total energy and electricity increased fast in the period 1970-1990, but from about 1995 the consumption
has flattened. Due to the very strong population increase in the used population projection, the energy
consumption is projected to increase slightly, but not of the same magnitude as in the 1970s and 1980s, thanks
to more efficient use.
The technologies used according to the analyses of the reference path are mainly air-air heat pumps in new single
family houses and existing single family houses continues to use direct electric heating in combination with fire
wood but with an increasing share of heat pumps. Multifamily houses will use a combination of district heat and
biomass boilers, but existing multifamily houses will also continue to use direct electric heating.
Analyses with a possibility to invest in energy efficiency measures decrease the energy use by 6 TWh in 2050,
resulting in the same energy use as in the base year. This comes in addition to the investment in heat pumps in
the reference path and the energy efficiency included in the projection of energy service demand of 7 TWh in
2050.
Figure 8 Development in the reference path of residential total energy use, electricity use, energy and electricity use per
capita and population. Unbroken line is statistics 1970-2009 and dash line is projection 2010 - 2050 (TWh/year, MWh/year
& capita and mill. persons)
0
1
2
3
4
5
6
7
0
10
20
30
40
50
60
70
1970
1990
2010
2030
2050
Population (mill.)
Energy use (TWh/year and MWh/capita)
Year
Total energy
Electricity
Energy/capita
El / capita
Population
4.1.2. Energy consumption
The residential energy service demand is analysed
with TIMES-Norway resulting in a demand of energy
carriers and use of different end use technologies. The
energy consumption is calculated to 52 TWh in 2050
and of this 38 TWh is electricity in the reference path.
The development of total energy as well as electricity
from 1970 to 2012 (statistics) compared to projected
future energy use to 2050 is presented in Figure 8 [10].
Due to the strong increase in population, both total
energy and electricity use increase slightly, but less
than the population growth. The indicators “energy
use per person” and “electricity use per person” both
decreas more than the past years. Both t tal energy
and electricity increased fast in th period 1970-1990,
but from about 1995 the consumption has flattened.
Due to the very strong population increase in the
used p pulation proje tion, the energy con umption
is pr jected to increase slightly, but not f the same
magnitude s in th 1970s and 1980s, thanks to more
efficient use.
The technologies used according to the analyses of the
reference path are mainly air-air heat pumps in new
single family houses and existing single family houses
continues to use direct electric heating in combination
with fire wood but with an increasing share of heat
pumps. Multifamily houses will use a combination
of district heat and biomass boilers, but existing
multifamily houses will also continue to use direct
electric heating.
Analyses with a possibility to invest in energy efficiency
measures decrease the energy use by 6 TWh in 2050,
resulting in the same energy use as in the base year. This
co s in addition to the investment in heat pumps in
the reference path and the energy efficiency included
in the projection of energy service demand of 7 TWh in
2050.
Figure 8
Development in the reference path of residential total energy use, electricity use, energy and electricity use per capita and population.
Unbroken line is statistics 1970-2009 and dash line is projection 2010 - 2050 (TWh/year, MWh/year & capita and mill. persons)