


 14 / 36

Position Paper: CenSES Energy demand projections towards 2050
14
e energy service demand by end-use is an important premise for calculation of future energy demand. T
put used for the present calculations are based on publications from NVE, Statistics Norway and buildi
gulations of 2010. The resulting energy service demand for space heating, water heating, lighting and ot
ectricity specific use and for each dwelling type (new and existing single family houses and multifamily hous
presented in Table 5.
e residential energy service demand from 2010 to 2050 based on the described assumptions is presented
gure 7. The reference path includes energy efficiency improvements from renovations and estimated effe
the directives of energy labelling of appliances and lighting. The energy service demand will increase from
h in 2010 to 51 TWh in 2030 and 55 TWh in 2050 in the reference path. Energy efficiency reduces the dema
7 TWh in 2050 in the reference path compared to a frozen efficiency path. The dwelling area increase fr
out 263 mill. m² in 2010 to about 420 mill. m² in 2050, an average yearly increase of 1.2%. If the populati
ojection instead of following the middle path of Statistics Norway will develop according to the high or l
ojections [5], the energy service demand is calculated to 24% higher or 15% lower than the reference path
50 (+13 TWh to – 8 TWh in 2050), as presented to the right in Figure 7.
Table 5 Residential energy service demand by end-use in 2010, kWh/dwelling
Existing dwellings
New dwellings
All Single fam.
Multi fam.
All
Single fam.
Multi fam.
Space heating
12 300
14 600
5 900
7 800
10 700
4 000
Water heating
2 600
2 900
1 700
2 300
2 900
1 700
Lighting
1 000
1 100
700
900
1 100
700
Other el. specific
3 500
4 000
2 300
3 200
4 000
2 300
Total
19 400
22 600
10 600
13 800
18 700
8 700
gure 7 Residential energy service demand 2010-2050 for the reference path to the left and with alternate population
ojections on the right; L=low, M=medium, H=high population growth, (TWh/year)
The energy service demand by end-use is an important premise for calculation of future e ergy demand. The
input used for the present calculations are based on publications from NVE, Statistics Norway and building
regulations of 2010. The resulting energy service demand for space heating, water heating, lighting and other
electricity specific use and for each dwelling type (new and existing single family houses and multifamily houses)
is presented in Table 5.
The residential energy service demand from 2010 to 2050 based on the described assumptions is presented in
Figure 7. The reference path includes energy efficiency improvements from renovations and estimated effects
of the directives of energy labelling of appliances and lighting. The energy service demand will increase from 44
TWh in 2010 to 51 TWh in 2030 and 55 TWh in 2050 in the reference path. Energy efficiency reduces the demand
by 7 TWh in 2050 in the reference path compared to a frozen efficiency path. The dwelling area increase from
about 263 mill. m² in 2010 to about 420 mill. m² in 2050, an average yearly increase of 1.2%. If the population
projection instead of following the middle path of Statistics Norway will develop according to the high or low
projections [5], the energy service demand is calculated to 24% higher or 15% lower than the reference path in
2050 (+13 TWh to – 8 TWh in 2050), as presented to the right in Figure 7.
Table 5 Residential energy service demand by end-use in 2010, kWh/dwelling
Existing dwellings
New dwellings
All Single fam.
Multi fam.
All
Single fam.
Multi fam.
Space heating
12 300
14 600
5 900
7 800
10 700
4 000
Water heating
2 600
2 900
1 700
2 300
2 900
1 700
Lighting
1 000
1 100
700
900
1 100
700
Other el. specific
3 500
4 000
2 300
3 200
4 000
2 300
Total
19 400
22 600
10 600
13 800
18 700
8 700
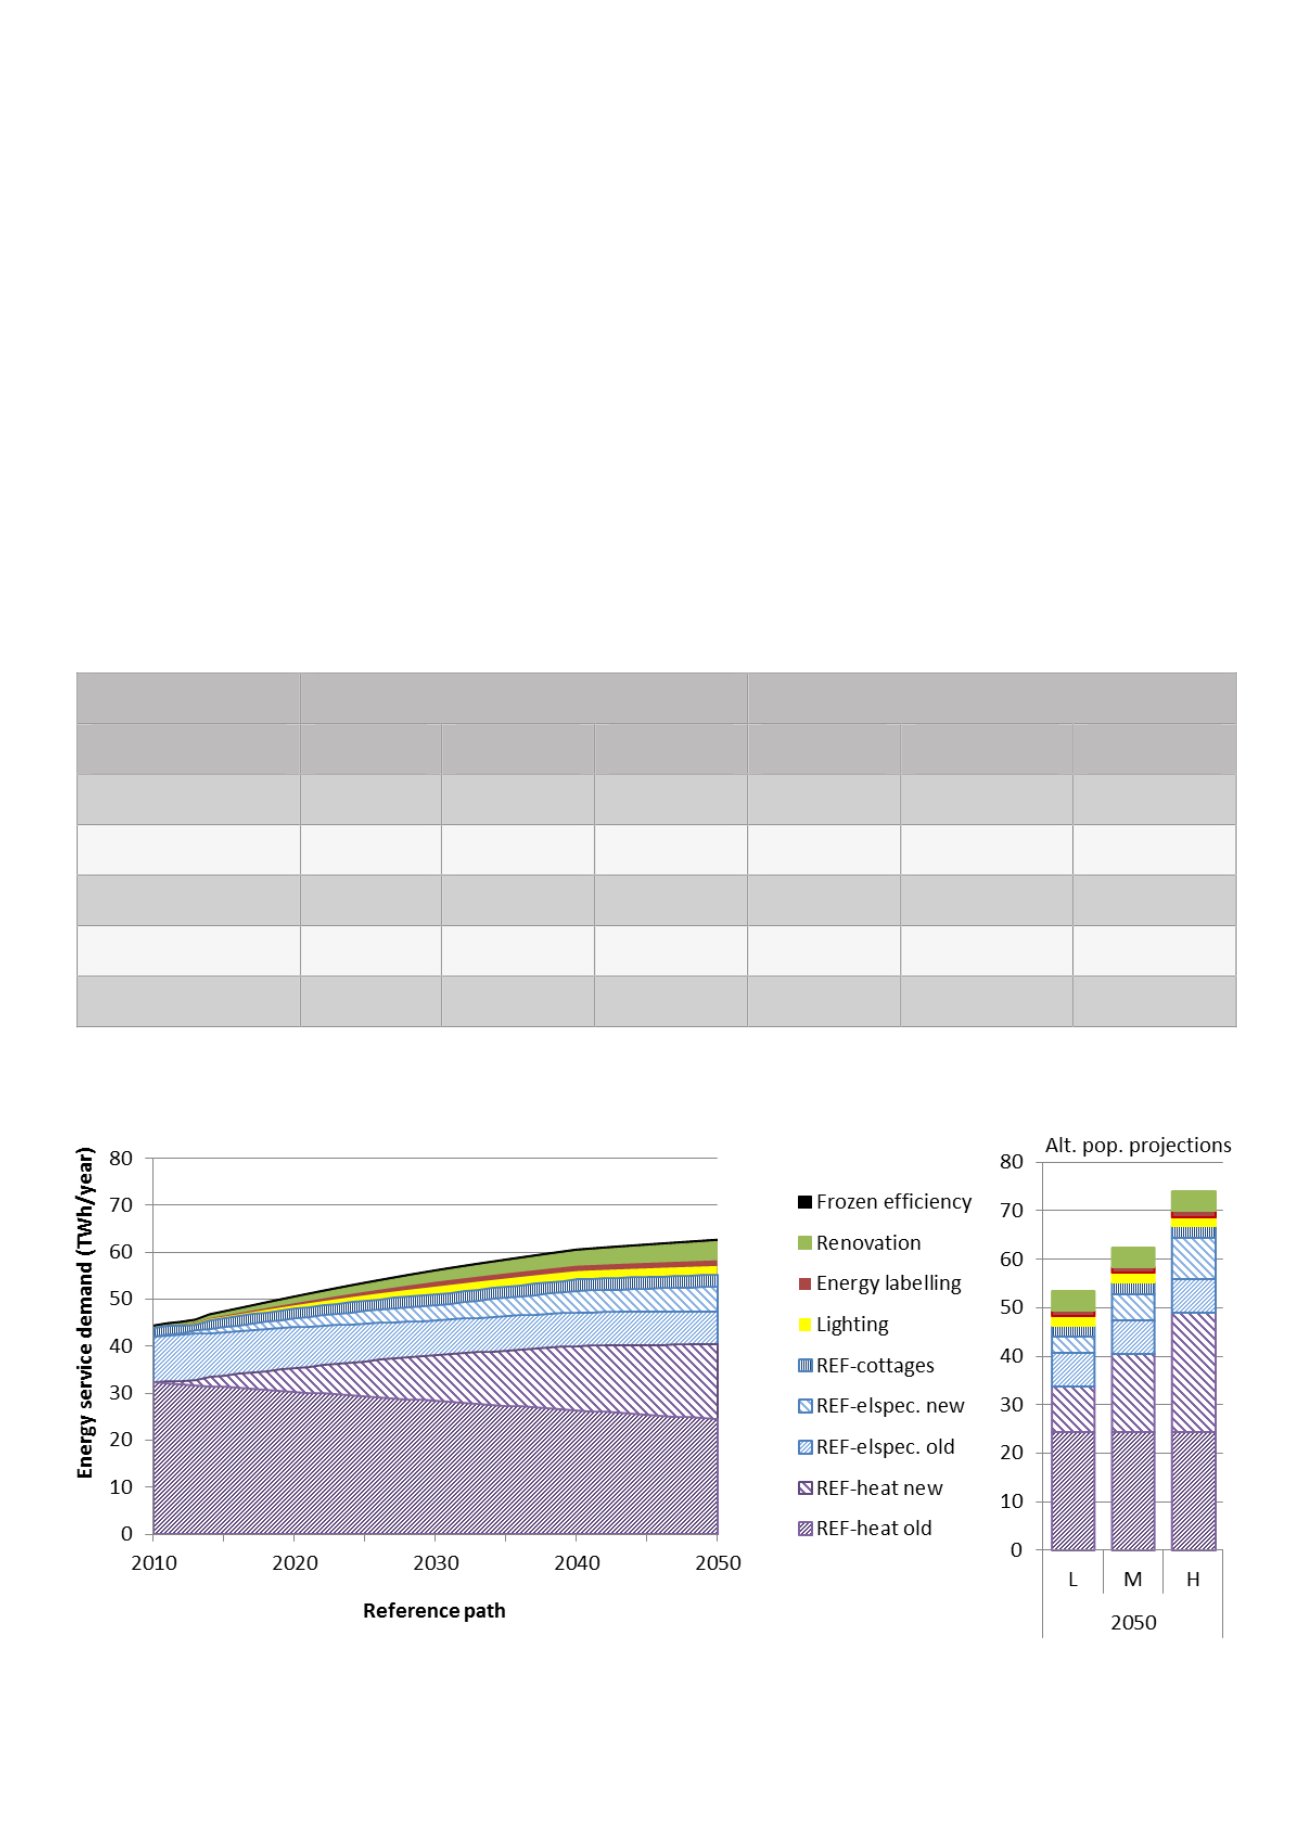
Figure 7 Residential energy service demand 2010-2050 for the reference path to the left and with alternate population
projections on the right; L=low, M=medium, H=high population growth, (TWh/year)
Th energy service demand by
use is an importan
premise f r calculation of future energy demand. The
input used for the present calculatio s are based on
publications from NVE, Statistics Nor ay a d buildi g
regulations of 2010. The resulting energy service
demand for space heating, water heating, lighting and
other electricity specific use and for each dwelling type
(new and existing single family houses and multifamily
houses) is presented in Table 5.
The residential energy service demand from 2010
to 2050 based on the described assumptions is
presented in Figure 7. The reference path includes
energy efficiency improvements from renovations and
le 5
Residential energy service demand by end-use i 2010, kWh/dwelling
Figure 7
Residential energy service demand 2010-2050 for the reference path to the left and with alternate population
projections o he right; L=low, M=m dium, H=high population growth, (TWh/year)
esti at d effects of the directives of energy labellin
of appl a ces and lighting. The energy se vice demand
will incre s from 44 TWh in 2010 to 51 TWh in 2030 and
55 TWh in 2050 in the reference path. Energy efficiency
reduces the demand by 7 TWh in 2050 in the reference
path compared to a frozen efficiency path. The dwelling
are increase from about 263 mill. ² in 2010 to about
420 mill. m² in 2050, an average yearly increase of 1.2%.
If the population projection instead of following the
middle path of Statistics Norway ill develop according
to the high or low p ojections [5], the energy service
demand is calculated to 24% higher or 15% l wer than
the reference path in 2050 (+13 TWh to – 8 TWh in
2050), as presented to the right in Figure 7.