


 19 / 36

19
Position paper - CenSES 1/2015
18
Position Paper: CenSES Energy demand projections towards 2050
2010
2030
2050
Population (mill.)
4.858
6.037
6.681
Annual area growth/
pop. growth
1.6 %
1.0 %
1.0 %
Annual renovation rate
2.0%
2.0%
Annual demolition rate
0.5%
0.5%
Table 7 Non-residential energy service demand by end-use in
2010 (kWh/m²)
Existing/New buildings
Heat
El. specific Cooling
Total
Education
100/90
69/41
0
169/132
Health
137/100
130/100
0
267/189
Hotel and
rest.
171/120
171/90
30/25
372/235
Offices
115/54
145/90
23/19
284/163
Trade
114/83
113/92
34/34
262/210
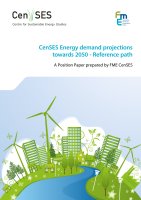
Figure 9 Energy service demand of tertiary sector, primary sector and building construction 2010-2050 in the reference
path to the left and with alternate population projections to the right (TWh/year)
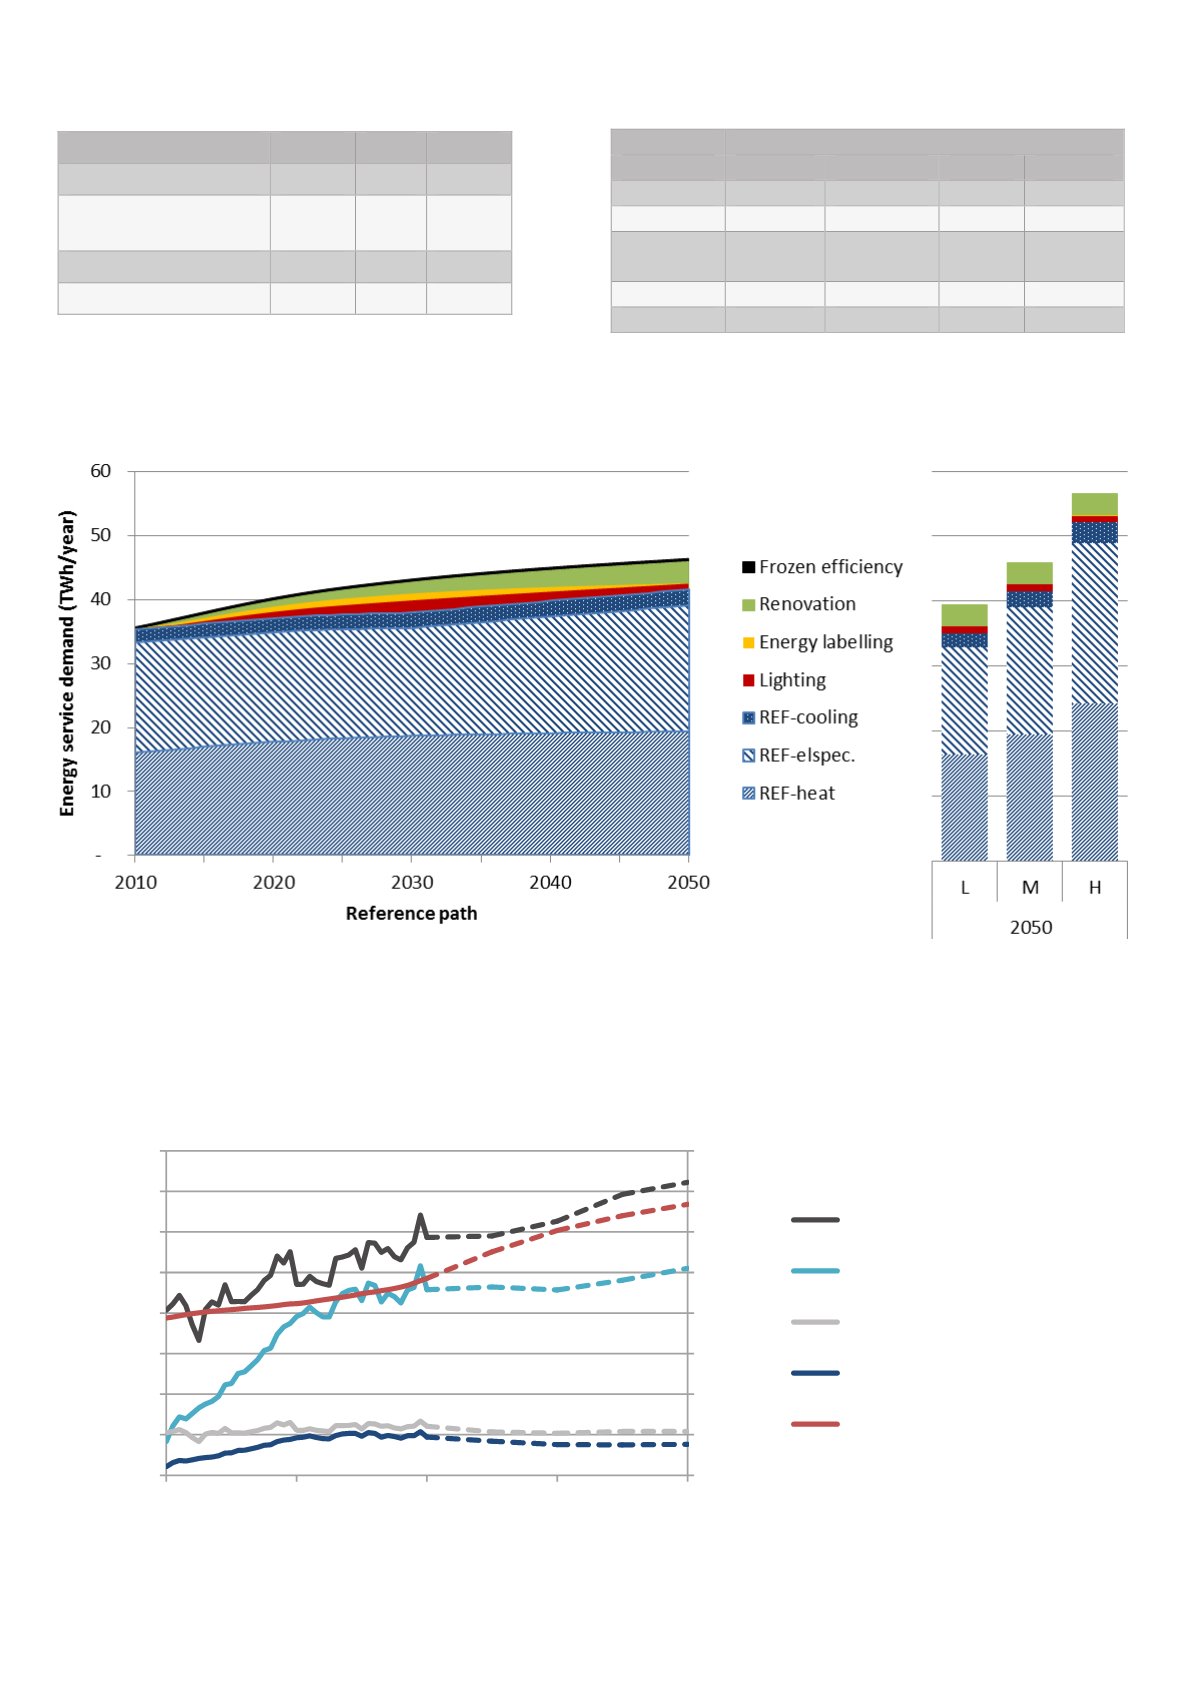
Figure 10 Development in the reference path of service total energy use, electricity use, energy and electricity use per
capita and population. Unbroken line is statistics 1970-2009 and dash line is projection 2010 - 2050 (TWh/year,
MWh/capita & year and mill. persons)
0
1
2
3
4
5
6
7
8
0
5
10
15
20
25
30
35
40
1970
1990
2010
2030
2050
Population (mill.)
Energy use (TWh/year and
MWh/capita)
Year
Total energy
Electricity
Energy/capita
Electricity/capita
Population
2010
2030
2050
pulation (mill.)
4.858
6.037
6.681
nual area growth/
p. growth
1.6 %
1.0 %
1.0 %
nual renovation rate
2.0%
2.0%
nual demolition rate
0.5%
0.5%
Table 7 Non-residential energy service demand by end-use in
2010 (kWh/m²)
Existing/New buildings
Heat
El. specific Cooling
Total
Education
100/90
69/41
0
169/132
Health
137/100
130/100
0
267/189
Hotel and
rest.
171/120
171/90
30/25
372/235
Offices
115/54
145/90
23/19
284/163
Trade
114/83
113/92
34/34
262/210
9 Energy service demand of tertiary sector, primary sector and building construction 2010-2050 in the reference
o the left and with alternate population projections to the right (TWh/year)
10 Development in the reference path of service total energy use, electricity use, energy and electricity use per
and population. Unbroken line is statistics 1970-2009 and dash line is projection 2010 - 2050 (TWh/year,
/capita & year and mill. persons)
0
1
2
3
4
5
6
7
8
0
5
10
15
20
25
30
35
40
1970
1990
2010
2030
2050
Population (mill.)
Energy use (TWh/year and
MWh/capita)
Year
Total energy
Electricity
Energy/capita
Electricity/capita
Population
2010
2030
2050
pulation (mill.)
4.858
6.037
6.681
nual area growth/
p. growth
1.6 %
1.0 %
1.0 %
nual renov tion rate
2 % 2.0%
nual demolition rate
0.5%
0.5%
2010 (kWh/m²)
Existing/New buildings
Heat
El. specific Cooling
Tot
Education
100/90
69/41
0
169/
Health
137/100
130/100
0
267/
Hotel and
rest.
171/120
171/90
30/25
372/
Offices
115/54
145/90
23/19
284/
Trade
114/83
113/92
34/34
262/
e 9 Energy service demand of tertiary sector, primary sector and building construction 2010-2050 in the reference
to the left and with alternate population projections to the right (TWh/year)
e 10 Development in the reference path of service total energy use, electricity use, energy and electricity use per
a and population. Unbroken line is statistics 1970-2009 and dash line is projection 2010 - 2050 (TWh/year,
/capita & year and mill. persons)
0
1
2
3
4
5
6
7
8
0
5
10
15
20
25
30
35
40
1970
1990
2010
2030
2050
Population (mill.)
Energy use (TWh/year and
MWh/capita)
Year
Total energy
Electricity
Energy/capita
Electricity/capita
Population
18
Position Paper: CenSES Energy demand projections towards 2050
2010
2030
2050
Population (mill.)
4.858
6.037
6.681
Annual area growth/
pop. growth
1.6 %
1.0 %
1.0 %
Annual renovation rate
2.0%
2.0%
Annual demolition rate
0.5%
0.5%
Table 7 Non-residential energy service demand by end-use in
2010 (kWh/m²)
Existing/New uilding
Heat
El. specific Cooling
Total
Education
100/90
69/41
0
169/132
Health
137/100
130/100
0
267/189
Hotel and
rest.
171/120
171/90
30/25
372/235
O fic
115/54
145/90
23/19
84/ 63
Trade
114/83
113/92
34/34
262/210
Figure 9 Energy service demand of tertiary sector, primary sector and building construction 2010-2050 in the reference
path to the left and with alternate population projections to the right (TWh/year)
Figure 10 Development in the reference path of service total energy use, electricity use, energy and electricity use per
capita and population. Unbroken line is statistics 1970-2009 and dash line is projection 2010 - 2050 (TWh/year,
MWh/capita & year and mill. persons)
0
1
2
3
4
5
6
7
8
0
5
10
15
20
25
30
35
40
1970
1990
2010
2030
2050
Population (mill.)
Energy use (TWh/year and
MWh/capita)
Year
Total energy
Electricity
Energy/capita
Electricity/capita
Population
able 7
Non-residential energy servic demand by end-us in 2010
(kWh/m²)
Figure 9
Energy service demand of tertiary sector, primary sector and building construction 2010-2050 in the reference path to the left and with
alternate population projections to he right (TWh/yea )
Figure 10
Development in the reference path of service total energy use, electricity use, energy and electricity use per capita and population.
Unbroken line is statistics 1970-2009 and dash line is projection 2010 - 2050 (TWh/year, MWh/capita & year and mill. persons)
Table 6
Key statistics and assumptions used in the projection
of the energy service demand of tertiary sector