


 21 / 36

21
Position paper - CenSES 1/2015
20
Position Paper: CenSES Energy demand projections towards 2050
3.3.2. Energy consumption
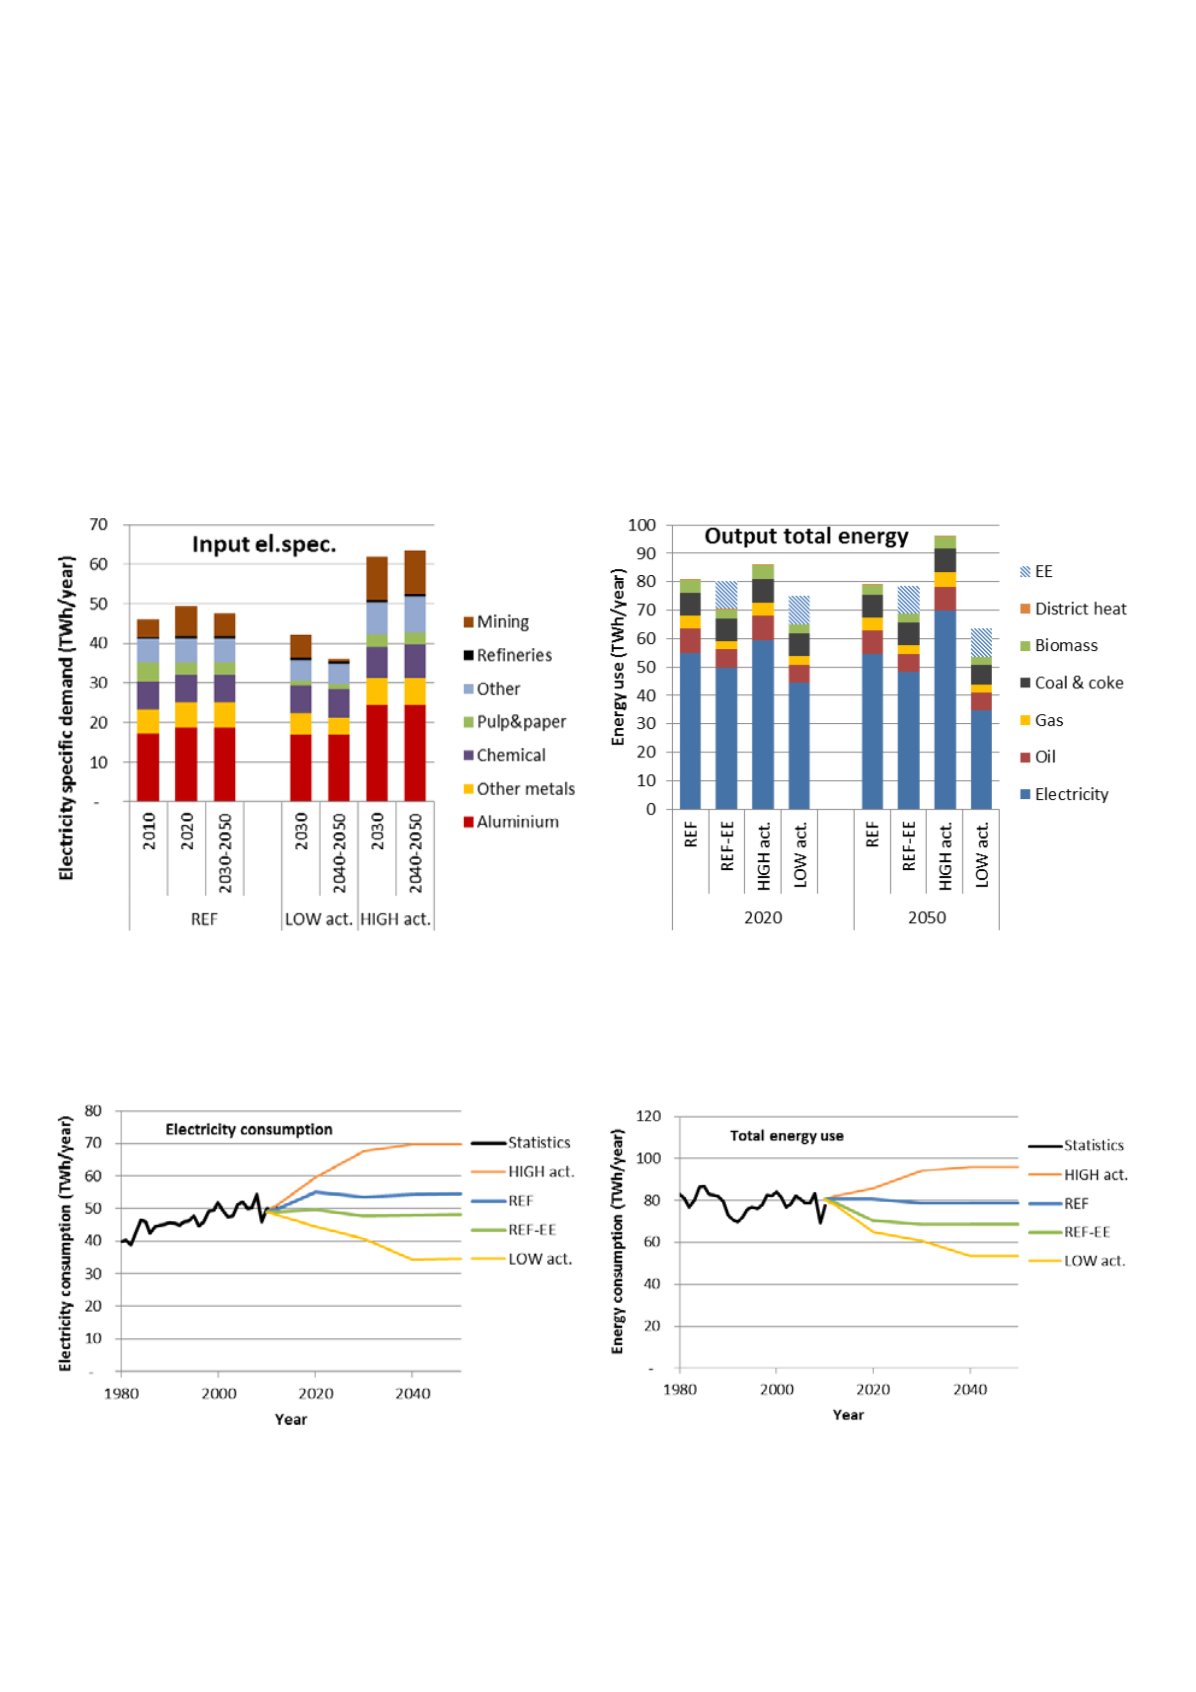
The decided production increases and decreases of the reference path results in a small decrease in total energy
use from 2010 to 2050 (-2 TWh). The use of electricity increases and the use of oil, gas and biomass decreases.
The energy use can be reduced by 10 TWh if profitable energy efficiency measures are implemented. The high
activity scenario results in an increased energy use of 15 TWh compared to the present use. The energy use
decrease by 27 TWh if the industry development is as in the low scenario with higher energy prices and
implementation of profitable energy efficiency measures.
The electricity consumption in industry varies in the analysed scenarios from a rather constant consumption in
the reference path with energy efficiency possibilities (-1 TWh in 2050 compared to 2010) and a small increase
without energy efficiency (+5 TWh in 2050) to an increase of 21 TWh in 2050 in the high activity scenario and a
decrease of 14 TWh in 2050 in the low activity scenario. The electricity consumption has increased 10 TWh the
past 30 years and has been rather constant the last 15 years, see Figure 13 [10].
Figure 11 Electricity specific demand in industry 2010-
2050 in the reference path, the LOW activity scenario
and in the HIGH activity scenario; Input to TIMES-
Norway (TWh/year)
Figure 12 Energy use by energy carrier in the analysed
industry scenarios in 2020, 2030 and 2050; Output from
TIMES-Norway (TWh/year)
Figure 13 Statistical development of electricity use 1980-
2012 and projection from 2010 to 2050 in the analysed
industrial scenarios (TWh/year)
Figure 14 Statistical development of total energy use
1980-2012 and projection from 2010 to 2050 in the
analysed industrial scenarios (TWh/year)
20
Position Paper: CenSES Energy demand projections towards 2050
3.3.2. Energy consumption
The decided production increases and decreases of the reference path results in a small decrease in total energy
use from 2010 to 2050 (-2 TWh). The us of electricity increases and the use of oi , gas and biomass d creases.
The energy use can be reduced by 10 TWh if profitable en rgy efficiency measures are implemented. The high
activity scenario results in an increased energy us of 15 TWh compared to the present use. The energy use
decreas by 27 TWh if the indu try development is as in the low scenario with higher en rgy prices and
implementation of profitable energy fficiency measures.
The electricity consumption in industry varies in the analysed scenarios from a rather constant consumption in
th reference path with energy efficiency possibilities (-1 TWh in 2050 comp red to 2010) and a small increase
without energy efficiency (+5 TWh in 2050) to an increase of 21 TWh in 2050 in the high activity scenario and a
decrease of 14 TWh in 2050 in the low activity scenario. The electricity consumption has increased 10 TWh the
past 30 years and has been rather constant the last 15 years, see Figure 13 [10].
Figure 11 Electricity specific demand in industry 2010-
2050 in the reference path, the LOW activity scenario
and in the HIGH activity scenario; Input to TIMES-
Norway (TWh/year)
Figure 12 Energy use by energy carrier in the analysed
industry scenarios in 2020, 2030 and 2050; Output from
TIMES-Norway (TWh/year)
Figure 13 Statistical development of electricity use 1980-
2012 and projection from 2010 to 2050 in the analysed
industrial scenarios (TWh/year)
Figure 14 Statistical development of total energy use
1980-2012 and projecti n from 2010 to 2050 in the
analysed industrial scenarios (TWh/year)
2. Energy consumption
decided production increases and decreases of the reference path results in a small decrease in total energy
from 2010 to 2050 (-2 TWh). The use of electricity increases and the use of oil, gas and biomass decreases.
energy use can be reduced by 10 TWh if profitable energy efficiency measures are implemented. The high
vity scenario results in an increased energy use of 15 TWh compared to the present use. The energy use
rease by 27 TWh if the industry development is as in the low scenario with higher energy prices and
lementation of profitable energy efficiency measures.
electricity consumptio in ind stry varies in the analysed scenar os from a rath r consta consumption in
reference path with energy efficiency possibilities (-1 TWh in 2050 compared to 2010) and a small increase
out energy efficiency (+5 TWh in 2050) to an increase of 21 TWh in 2050 in the high activity scenario and a
rease of 14 TWh in 2050 in the low activity scenario. The electricity consumption has increased 10 TWh the
t 30 years and has been rather constant the last 15 years, see Figure 13 [10].
re 11 Electricity specific demand in industry 2010-
0 in the reference path, th LOW activity scenario
in the HIGH activity scenario; Input to TIMES-
way (TWh/ye r)
Figure 12 Energy use by energy carrier in the analysed
industry scenarios in 2020, 2030 and 2050; Output from
TIMES-Norway (TWh/year)
re 13 Statistical development of electricity use 1980-
2 and projection from 2010 to 2050 in the analysed
strial scenarios (TWh/year)
Figure 14 Statistical development of total energy use
1980-2012 and projection from 2010 to 2050 in the
analysed industrial scenarios (TWh/year)
3.3.2. Energy consumption
The decided production increas s and decreases of the reference path results in a small decrease in total nergy
use from 2010 to 2050 (-2 TWh). he use of electricity increases and the use of oil, gas and biomass decreases.
The e ergy use can be reduced by 10 TWh if profitable energy efficiency measures are implement d. The high
activity scenario results in an increas d energy u e of 15 TWh compared to the present use. The energy use
d creas by 27 TWh if the industry developmen is as in the low scenario with high r energy prices and
implementation f profitable energy efficiency measures.
The el ctricity consumption in industry varies in the analysed scenarios from a rath r constant consumption in
the reference path with e ergy efficiency possibilitie (-1 TWh in 2050 compar d to 2010) and a small increase
without energy efficiency (+5 TWh in 2050) to an increase of 21 TWh in 2050 in the high activity scenario and a
decrease of 14 TWh in 2050 in the low activity scenario. The electricity consumption has increased 10 TWh the
past 30 years a d h s been rather constant the las 15 years, see Figure 13 [10].
Figure 11 Electricity specific demand in industry 2010-
2050 in the refer nce path, the LOW activity cenario
and in the HIGH activity scenario; Input to TIMES-
Norway (TWh/year)
Figure 12 Energy use by energy carrier in the analysed
industry scenarios in 2020, 2030 and 2050; Output from
TIMES-N rway (TWh/year)
Figure 13 Statistical development of electricity use 1980-
2012 and projection from 2010 to 2050 in the analysed
industrial scenarios (TWh/year)
Figure 14 Statistical development of total energy use
1980-2012 and projection from 2010 to 2050 in the
analysed industrial scenarios (TWh/year)
4.3.2. E ergy co sumption
The deci ed pr duction incre ses and decr ases of the
reference path results in a sm ll decr ase in total energy
use from 2010 to 20 (-2 TWh). The use of electricity
increases and the use of oil, gas and biomass decreases.
The energy use can be reduced by 10 TWh if profitabl
energy effici ncy measures are implemented. The high
activity scenario results in an increase en rgy use
of 15 TWh compared to the pre ent use. The ene gy
use decrease by 27 TWh if the industry development
is as in the low scenario with igher energy prices
and implementation of profitable energy efficiency
mea ur s.
Figure 11
Electricity specific demand in industry 2010-2050 in the
reference path, the LOW activity scenario and in the HIGH activity
scenario; Input to TIMES-Norway (TWh/year)
Figure 12
Energy use by energy carrier in the analysed industry
scenarios in 2020, 2030 and 2050; Output from TIMES-Norway (TWh/
year)
Figure 13
Statistical development of electricity use 1980-2012 and
projection from 2010 to 2050 in the analysed industrial scenarios
(TWh/year)
Figure 14
Statistical development of total energy use 1980-2012 and
projection from 2010 to 2050 in the analysed industrial scenarios
(TWh/year)
The elec ricity con umption in industry varies in th
analyse scenarios from a rather constant co sumption
in the reference path with energy efficiency possibilities
(-1 TWh in 2050 co pared to 2010) and a small increase
without energy efficiency (+5 TWh in 2050) to an
increase of 21 TWh in 2050 in the high activity scenario
and decrease of 14 TWh in 2050 n the low activity
scenario. The electricity consumption has incr ased 10
TWh the past 30 ye rs and has been rather consta t the
last 15 years, see Figure 13 [10].