


 13 / 36

13
Position paper - CenSES 1/2015
12
Position Paper: CenSES Energy demand projections towards 2050
3. Projections by sector
3.1.Residential sector
3.1.1. Energy service demand
The projection of energy service demand of households (E) is calculated as dwelling area (A) multiplied by specific
energy service demand (I):
E = A * I = dwelling area (m
2
) * specific energy service demand (kWh/m
2
)
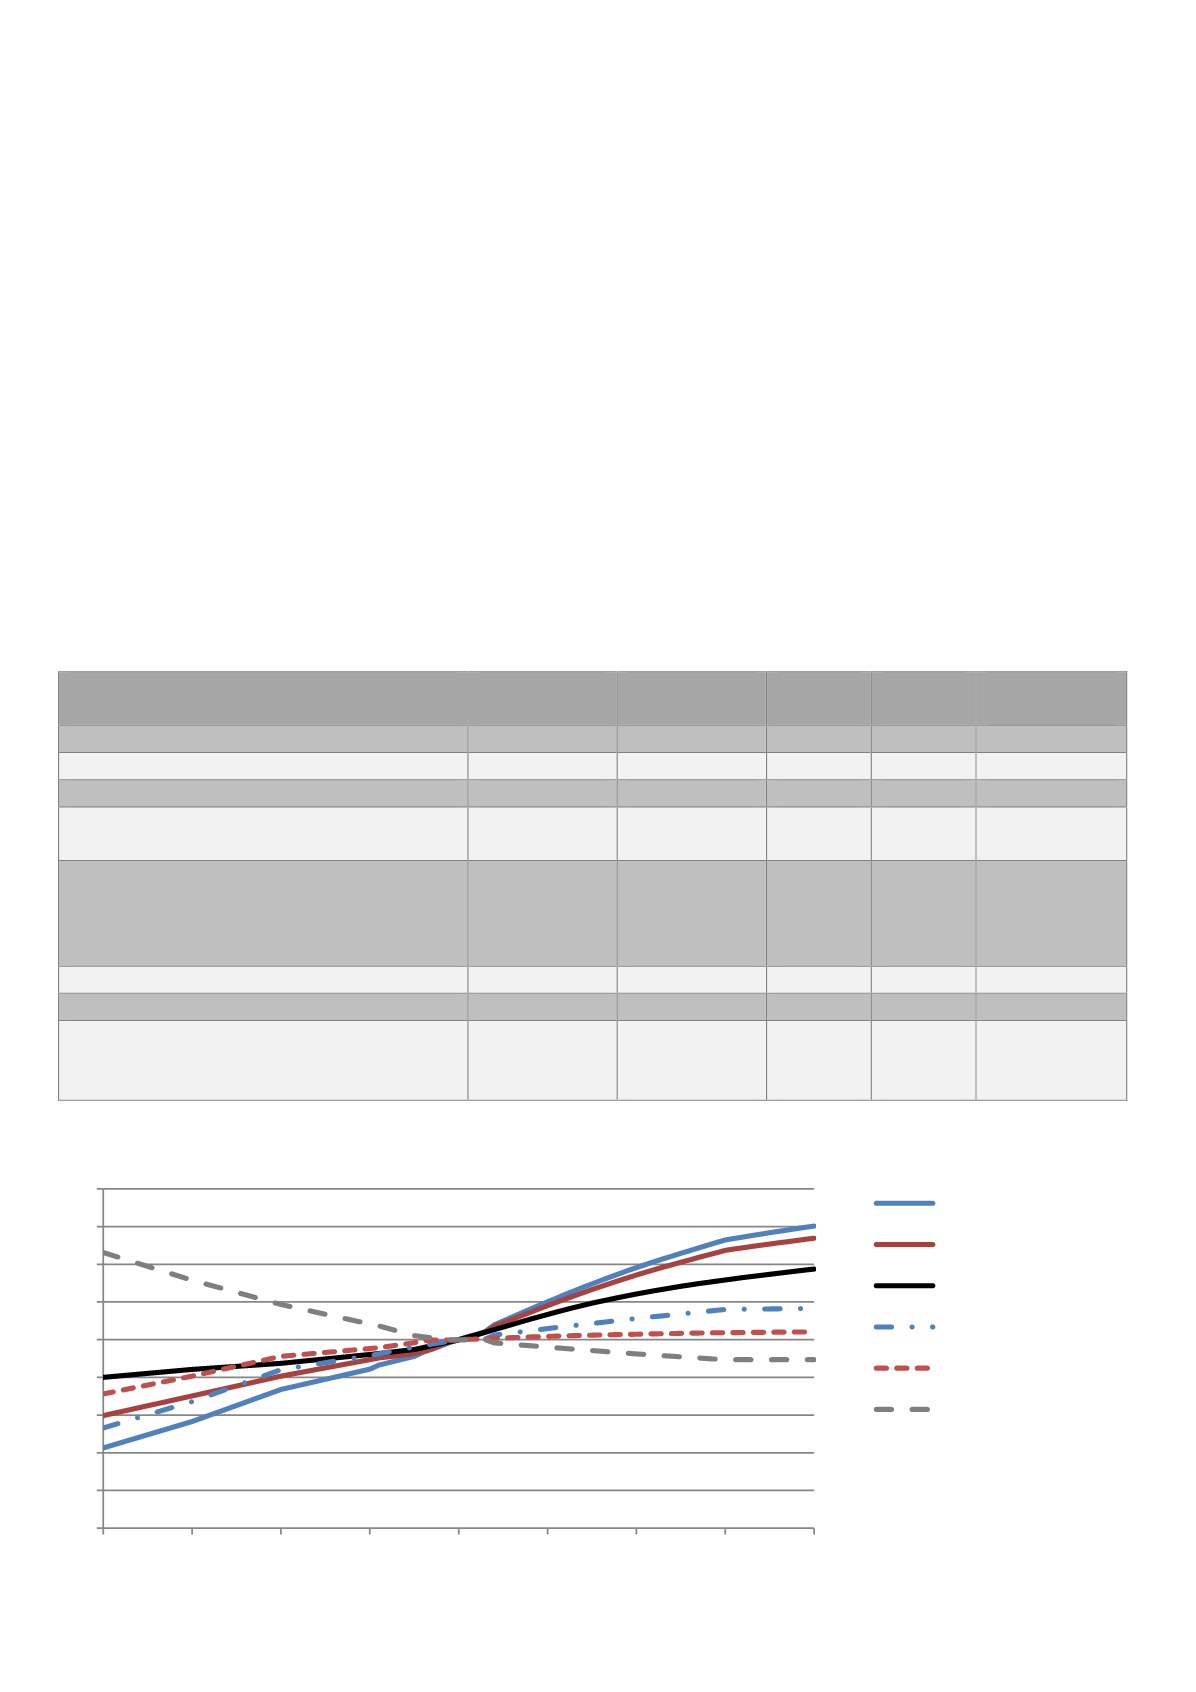
Future dwelling area is calculated based on development of different parameters derived on historical evolution.
Most of the key statistics and assumptions are presented in. The resulting development of number of households
and household area is larger than the population growth. The area per dwelling and per person will also increase
while the number of persons per dwelling will continue to decrease. The reasons behind the assumptions are
described in [4]. The relative evolution of both historical data from 1970 to 2012 and projection 2012-2050, with
2010 as the base year is presented in Figure 6.
Table 4 Key statistics and assumptions used in the projection of residential energy service demand
Starting year
Starting value
2030
2050
Yearly growth
2010-2050
Population (mill.)
2010
4.858
6.037
6.681
0.80%
Households (mill.)
2010
1.587
1.982
2.197
1.08%
Persons per household
2010
2.24
2.07
2.00
-0.28%
Share of multifamily houses of new
dwellings
2000-2013
55.9%
56%
56%
Area per new dwelling (m
2
/dwelling)
- single family house
- multifamily house
- average
2009-2013
163.8
93.0
133.0
164
93
133.0
164
93
133.0
Renovation rate (% per year)
2.0%
2.0%
Demolition rate (% per year)
0.3%
0.3%
Alternative population projections:
- Low LLML
- High HHMH
2010
2010
4.858
4.858
5.607
6.553
5.646
8.393
Figure 6 Relative development of key parameters of residential projection; statistics 1970-2012, projection 2012-2050;
2010=1
0
0,2
0,4
0,6
0,8
1
1,2
1,4
1,6
1,8
1970 1980 1990 2000 2010 2020 2030 2040 2050
Area
Households
Population
Area per person
Area per dwelling
Persons per household
3. Projections by sector
3.1.Residential sector
3.1.1. Energy service demand
The projection of energy service de and of
l ( ) is calculated as dwelling area (A) multiplied by specific
en rgy service demand (I):
E = A * I = dwel ing r
ner y service demand (kWh/m
2
)
Fut re dwelling area is calculated base o
l
f ifferent parameters derived on historical evolution.
Most of the key statistics and as u ptions r r
t i . he resulting development of number of households
and household area is larger than the populati r t . The area per dwelling and per person will also increase
while the number of persons per dwelling will continue to decrease. The reasons behind the assumptions are
described in [4]. The relative evolution of both historical data from 1970 to 2012 and projection 2012-2050, with
2010 as the base year is presented in Figure 6.
Table 4 Key statistics and assumptions used in the projection of residential energy service demand
Starting year
Starting value
2030
2050
Yearly growth
2010-2050
Population (mill.)
2010
4.858
6.037
6.681
0.80%
Households (mill.)
2010
1.587
1.982
2.197
1.08%
Persons per household
2010
2.24
2.07
2.00
-0.28%
Share of multifamily houses of new
dwellings
2000-2013
55.9%
56%
56%
Area per new dwelling (m
2
/dwelling)
- single family hous
- multifamily house
- av rage
2009-2013
163.8
9
133.0
164
93
133.0
164
93
133.0
Renovation rate (% per year)
2.0%
2.0%
Demolition rate (% per year)
0.3%
0.3%
Alternative population projections:
- Low LLML
- High HHMH
2010
2010
4.858
4.858
5.607
6.553
5.646
8.393
Figure 6 Relative development of key parameters of residential projection; statistics 1970-2012, projection 2012-2050;
2010=1
0
0,2
0,4
0,6
0,8
1
1,2
1,4
1,6
1,8
1970 1980 1990 2000 2010 2020 2030 2040 2050
Ar a
Households
Po ulation
Area per person
Area per dwelling
Persons per household
4. Projections by sector
4.1. Residential sector
4.1.1. Energy service demand
The projection of energy service demand of households
(E) is calculated as dwelling area (A) multiplied by
specific energy service demand (I):
E = A * I = dwelling area (m
2
) * specific energy service
demand (kWh/m
2
)
Future dwelling
i c lcula ed bas d n
development of different parameters d rived on
histo cal evolution. Most of the key statistics and
le 4
Key statistics and ssumptions used in the projection of residential energy service demand
Figure 6
Relative development of key parameters of residential projection; statistics 1970-2012, projection 2012-2050; 2010=1
assumptions are presented in Table 4. The resulting
development of number of households and household
area is larger than the population growth. The area
per dwelling and per person will also increase while
the number of persons per dwelling will continue to
decrease. The reasons behind the assumptions are
describ d in [4]. The relativ evolution of bot hi torical
data from 1970 to 2012 and p ojectio 2012-2050, with
2010 as the base year is pres nte in Figure 6.