


 161 / 390

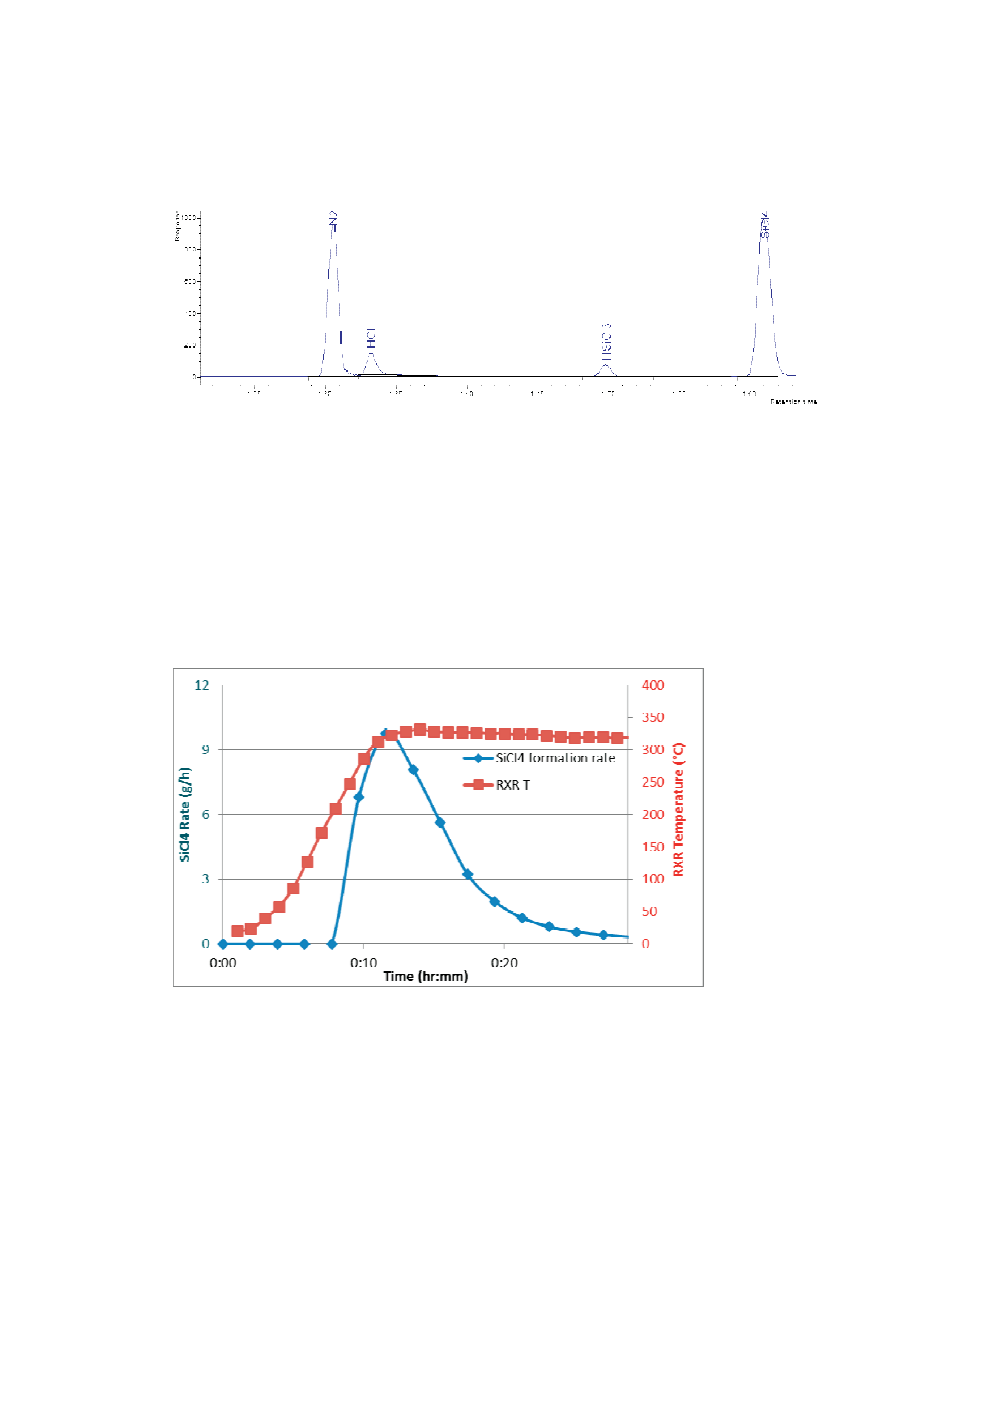
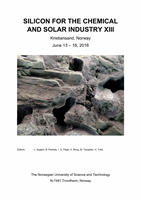
Figure 1.
GC chromatogram of the gas product mixture from the reaction of Si with
CuCl.
The constant flow of N
2
gas served two functions: as a carrier gas to move products
out of the reactor and as an internal standard for quantifying product formation rates.
Figure 2 shows SiCl
4
formation rate (blue line) and reactor temperature (red line) over
the course the reaction. No product was detected below 220 °C. The SiCl
4
formation
rate drastically increased when reactor temperature reached ~280 °C and dropped near
zero about 20 minutes later. Calculation of the area under the blue curve in Figure 2
gave rise to total amount of SiCl
4
formed. Four experiments were performed and the
average yield of SiCl
4
was found to be 107(±4)%.
Figure 2.
SiCl
4
formation rate (blue line with diamonds) and reactor temperature (red
line with squares) curves vs time.
Although the above experiments provide accurate quantification of products, the
reactor temperature-control and the time-resolution of GC were not ideal for
measuring the reaction onset temperature. However, confirmation of SiCl
4
as the main
product allowed us to monitor its formation with a mass spectrometry (MS) method,
and use that as an indicator for reaction rate and progress. The MS method provides
significantly higher sensitivity and shorter cycle time (~0.1 minute). The higher
sensitivity of the MS method also allows use of less reaction mass (~0.5 g) and use of
a chemisorption analyser (CA) to provide better temperature control.
153