


 122 / 390

The three dimensional morphology of pyrogenic silica is a direct consequence of the
production temperature above melting temperature of silica and the strong influence of
temperature on melt viscosity of silica. In certain temperature range only partly fusion
of silica particles after collision is possible due to high viscosity of molten SiO
2
. This
results in hard, permanent sintered aggregates which are the ultimate particle form of
pyrogenic silica. In contrast to colloidal silica which forms in a low temperature
precipitation process in aqueous solution, isolated primary particles have never been
observed for pyrogenic silica.
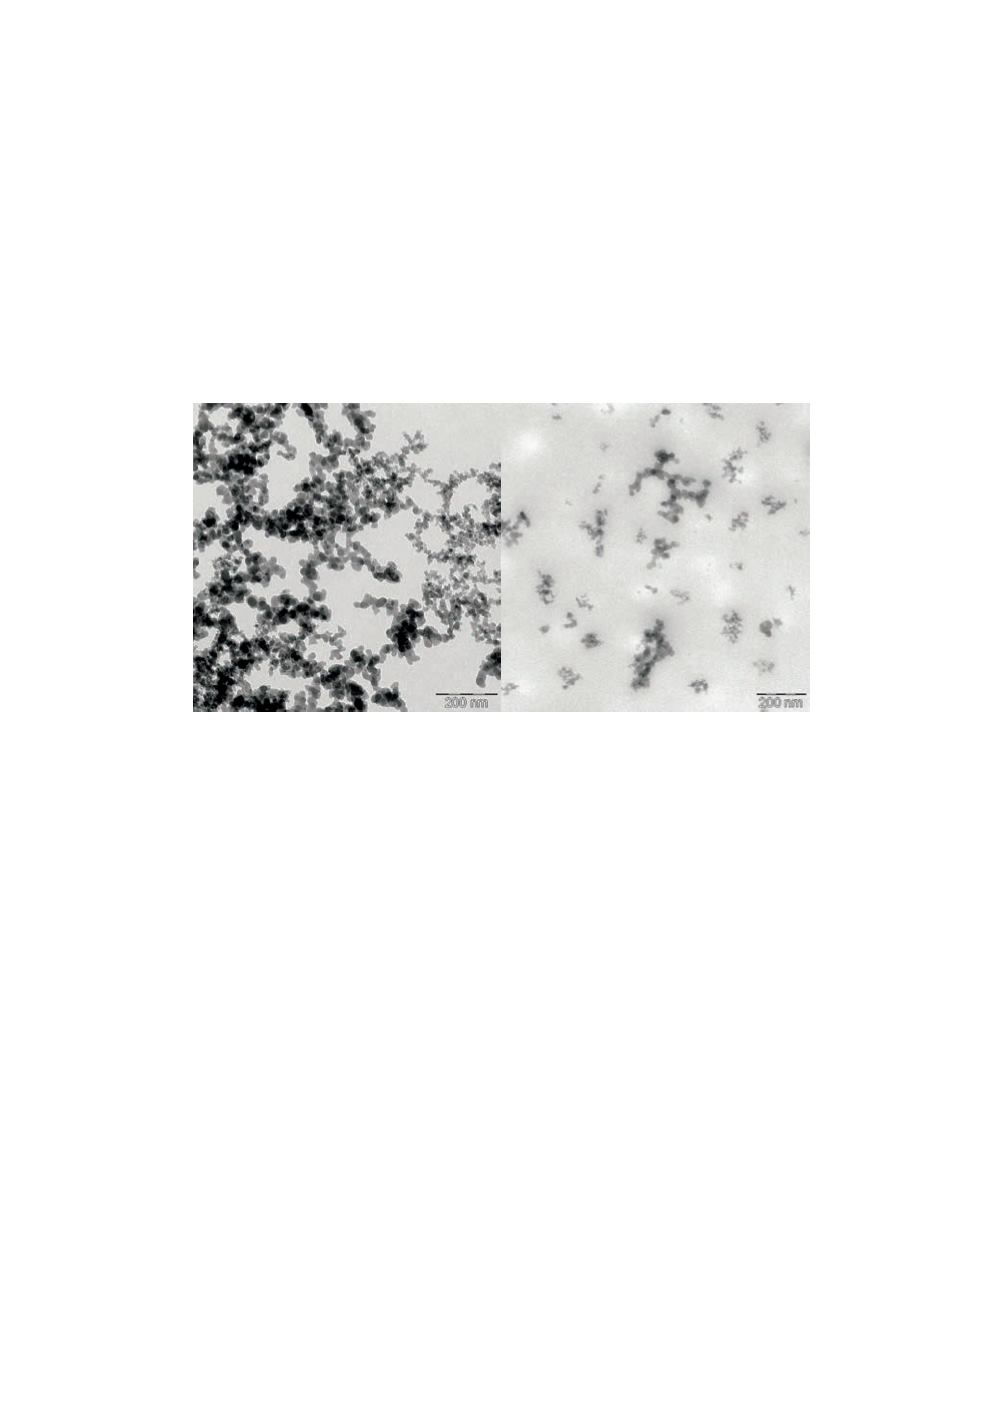
Fig. 9 depicts TEM micrographs showing pyrogenic silica aggregates without (left) and
with (right) application of intense shear force during sample preparation.
Figure 9:
TEM micrographs of silica aggregates without application of shear (left; dry
powder on TEM grid) and with application of shear (right; embedded in cured epoxy
resin).
In order to describe the irregular structure of pyrogenic silica aggregates the concept of
fractals and self-similarity is often used. Fractal systems follow the fundamental
relation 6 [27].
ܯ
ሺ݈ሻ ̱ ݈
(6)
The relation states that the mass of a fractal object within a set of concentric spheres
decreases with decreasing radius l of the spheres according to l
D
. Exponent D of the
power law is called the fractal dimension of mass. Scattering methods like small angle
X-ray scattering (SAXS) are often used to study the structure of fractal objects.
Parameters like the fractal dimension D
m
can be extracted from a I(q
-1
) vs. q
-1
scattering
plot where I is the scattering intensity and q is the magnitude of wave vector, where q
= 4
π
/
λ
sin(
θ
/2),
θ
is the scattering angle, and
λ
the wave length. Fig. 10 displays
scattering data for pyrogenic silica of 200 m
2
/g specific surface area. The plot reveals
two power-law regimes. The low q-regime reflects scattering from fractal aggregates.
The fractal dimension can be directly extracted from the power-law slope, which is 2.13
for the example shown. The high q-regime is due to scattering at the primary particle
surface. From the power-law slope here a so-called surface fractal dimension D
s
can be
calculated using the relation I
∼
q
(-P)
where P = 6 – D
s
, which in this case results in a
surface fractal dimension of 1.93. D
s
of close to 2 is indicative of a essentially flat
114