


 118 / 390

Properties of Pyrogenic Silica
Main characteristics of pyrogenic silica are a large specific surface area and a complex
hierarchical morphology consisting of primary particles, aggregates, and agglomerates.
Pyrogenic silicas are available in a specific surface range of 50 – 400 m
2
/g. The
surface area is measured by nitrogen gas adsorption and calculated from the adsorption
isotherm by means of the Brunauer-Emmett-Teller equation, resulting in the so-called
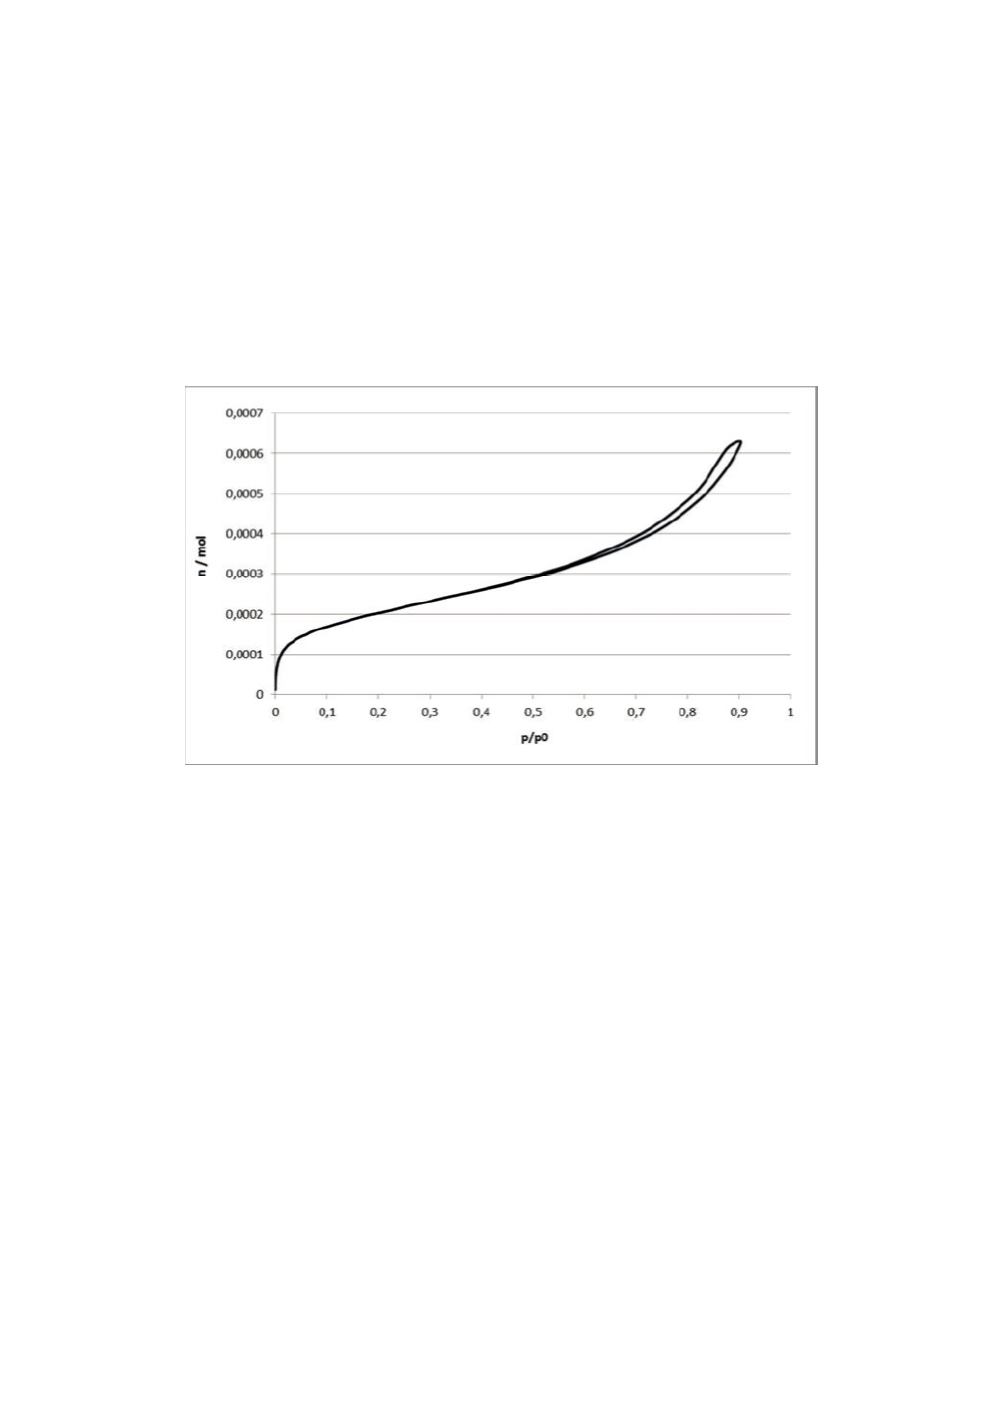
BET surface area [7]. In fig. 3, a typical gas adsorption isotherm of pyrogenic silica is
depicted.
Figure 3:
Nitrogen gas adsorption isotherm of pyrogenic silica.
The gas adsorption isotherm of fig. 3 belongs to the type IV isotherms according to the
classification of Brunauer, Deming, Deming and Teller and is characterized by a
hysteresis loop in the large relative pressure p/p
0
range. The hysteresis loop is due to
capillary condensation of nitrogen in silica mesopores [8].
The surface structure of pyrogenic silica is complex and still a matter of research.
The sharp upturn of the gas adsorption isotherm in the low p/p
0
range indicates high
surface energy. From the BET analysis a non-specific silica surface energy
ߛ
௦ ௗ
of 134
mJ/m
2
has been calculated[9]. However, this value is probably too high and biased by
specific interaction resulting from surface silanol groups (Si-OH) with nitrogen
molecules. Using Inverse Gas Chromatography (IGC) in infinite dilution mode a
ߛ
௦ ௗ
of
ca. 60 mJ/m
2
for a pyrogenic silica with a specific surface area (SSA) of 200 m
2
/g was
found[10], which is a more reasonable number for pure non-specific interactions. The
energetic heterogeneity of the pyrogenic silica surface is corroborated by IGC
experiments in finite dilution mode. Fig. 4 shows the adsorption energy distribution
calculated for the abovementioned 200 m
2
/g silica and hexylamine as the IGC probe.
The distribution function shows two modes, one low-energy peak at ca. 23 kJ/mol and
a peak at ca. 35 kJ/mol for the high-energy sites.
110