


 120 / 390

Si
O
Si
OH
Si
Si
O
H
O
H
H
OH
H
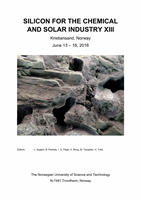
Figure 6:
Hydrogen bonds at silanol groups.
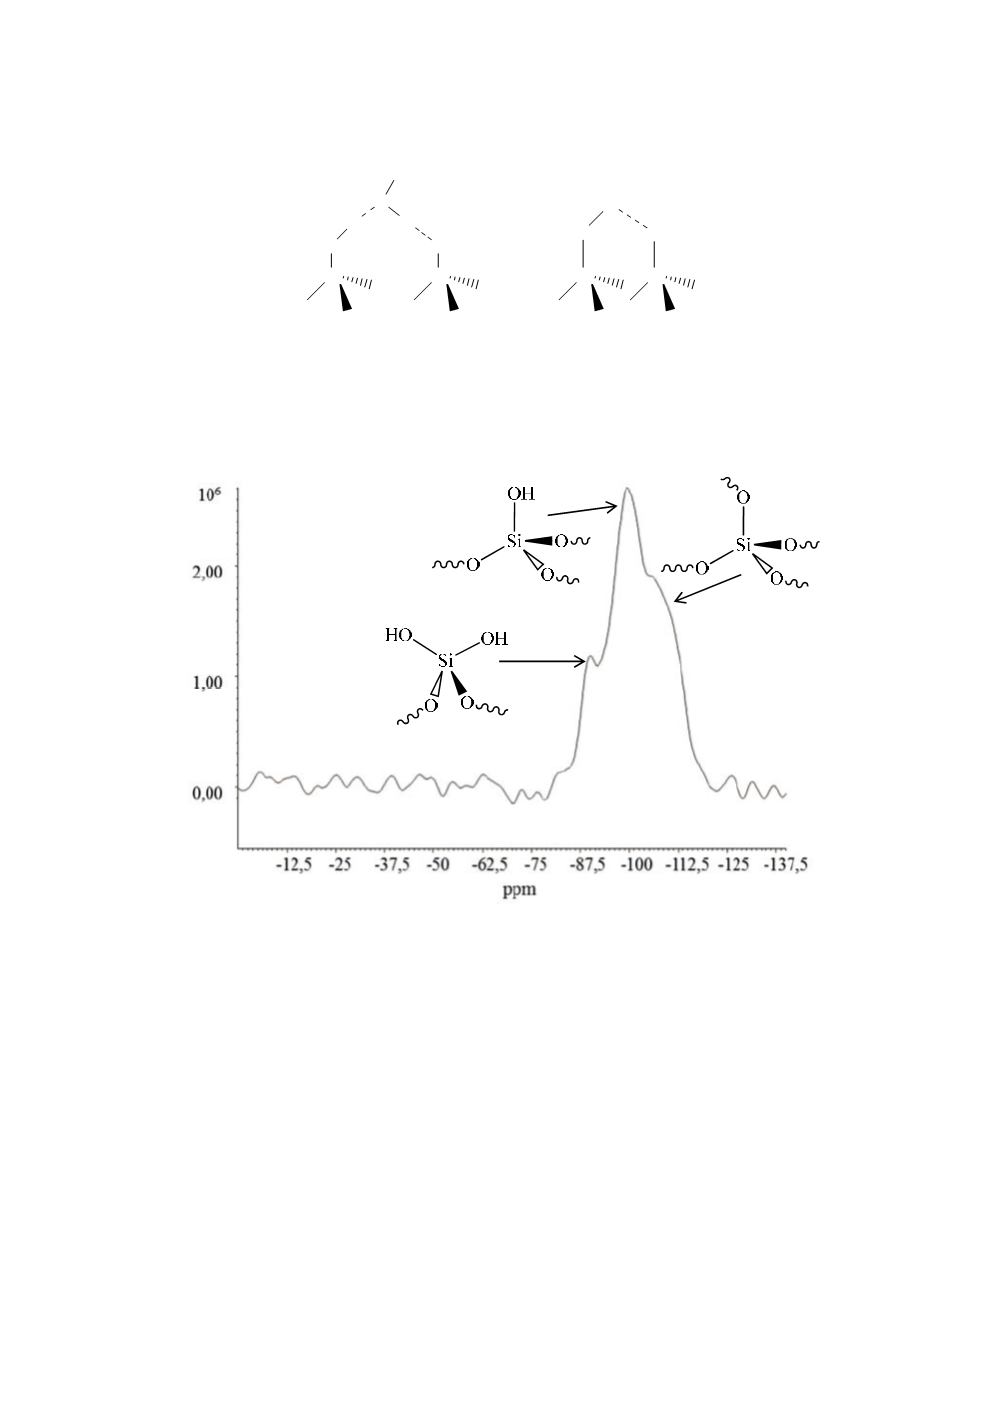
More details about different silanol structures on silica surface can be obtained from
solid state NMR spectroscopy [13-15]. Fig. 7 shows a solid state
29
Si CPMAS spectrum
of pyrogenic silica of 200 m
2
/g specific surface area.
Figure 7:
29
Si CPMAS spectrum of pyrogenic silica of 200 m
2
/g specific surface area.
The spectrum shows 3 signals at -90 ppm, -100 ppm, and a shoulder at -110 ppm,
respectively. The first signal can be assigned to geminal silanol groups (Q2 groups),
the second peak to isolated or vincinal silanol groups (Q3 groups) and the shoulder can
be assigned to the Q4 backbone (SiO
4/2
)[16]. NMR spectroscopy in CPMAS mode is a
non-quantitative method. Hence, the intensities of the signals do not reflect the real
molar fraction of the corresponding silicon atoms and silanol group density of the silica
surface cannot be calculated from these data.
However, the silanol group density is an important parameter affecting several
fundamental properties of pyrogenic silica, for example: i) colloidal stability of aqueous
pyrogenic silica dispersions, ii) polymer adsorption due to specific interactions, or iii)
grafting density of surface modified silica. Determination of silanol group density is a
delicate analytical challenge. Different methods such as spectroscopy (IR, NMR),
thermogravimetry [17], mass spectrometry [18], acid-base titration [19], gas volumetry
using LiAlH
4
or organometallic compounds (MeLi )[20], or chemical modification
112