


 119 / 390

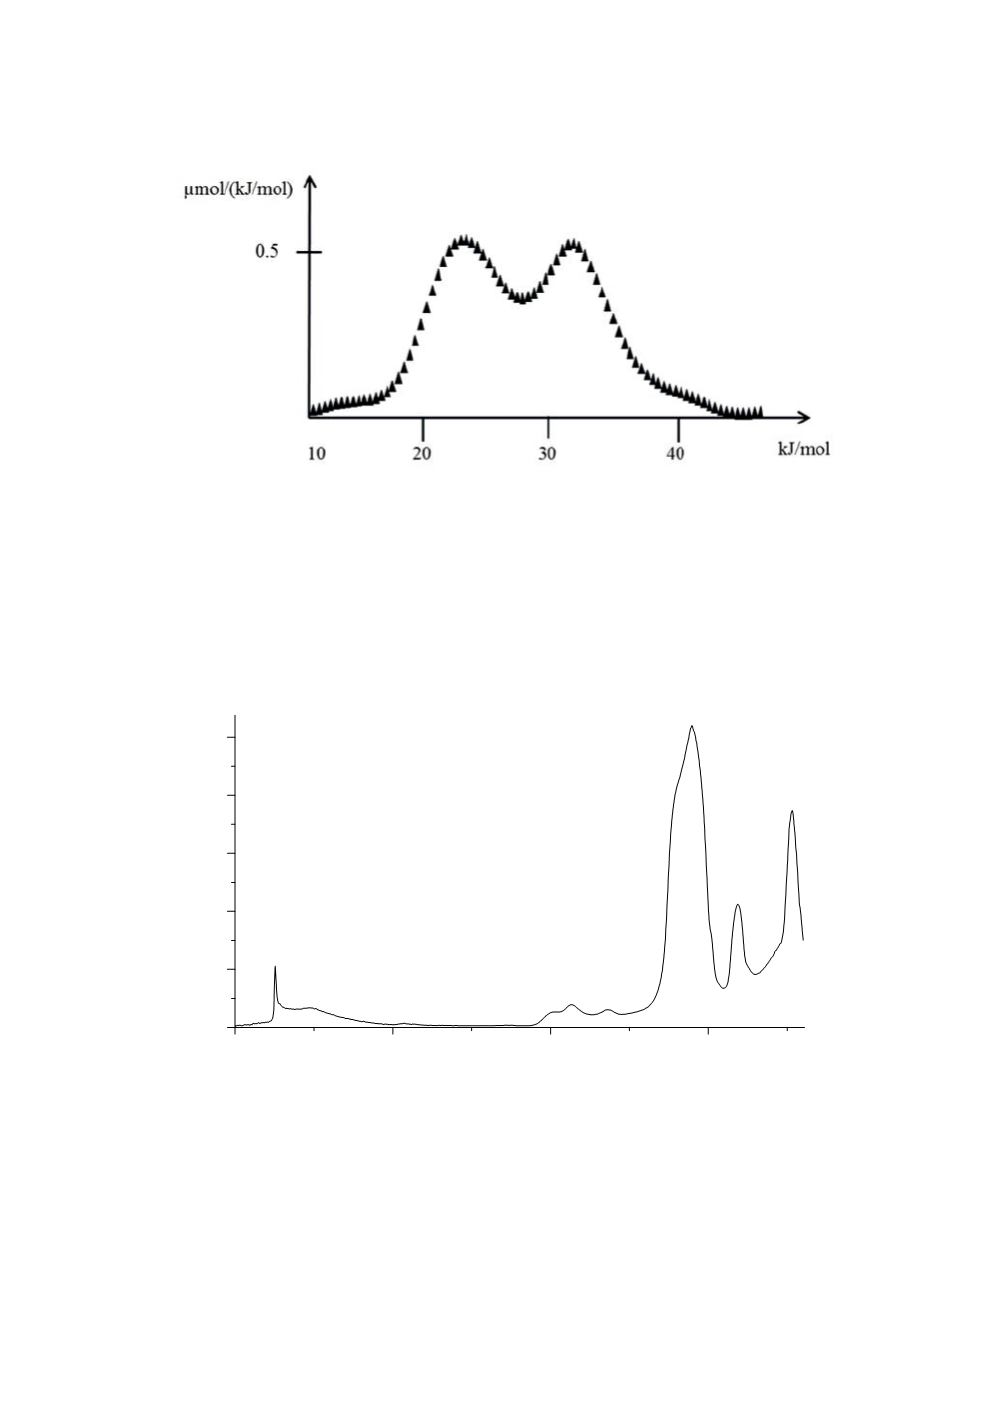
Figure 4:
Adsorption energy distribution calculated for a 200 m
2
/g silica and
hexylamine as IGC probe.
The high-energy peak can be assigned to the specific interaction of hexylamine with
silanol groups.
The existence of silanol groups at the silica surface have been proven by IR and NMR
spectroscopy, respectively [11, 12]. Fig. 5 reveals a typical DRIFT spectrum of
pyrogenic silica.
Figure 5:
DRIFT spectrum of pyrogenic silica in KBr.
The sharp peak at 3745 cm
-1
can be assign to isolated SiOH groups. The broad
resonance from ca. 3740 to ca. 3100 cm
-1
is caused by hydrogen bond coupled silanols.
The hydrogen bond can be formed between silanol and water molecules or between two
silanol groups close to each other, respectively, as depicted in fig.6.
4000
3000
2000
1000
0,0
0,2
0,4
0,6
0,8
1,0
cm
-1
111