


 112 / 390

subject of exclusively random variations. Keeping the potential pathways for boron
losses in mind, the distribution of the individual results and the absence of a
significant peak of individual values in the range of the averaged reference value
indicated systematically inferior results.
9 10 11 12 13 14 15 16
0
3
6
9
12
15
18
Ref. 1A
absolute frequency
boron content / μg g
-1
36 38 40 42 44 46 48
0
3
6
9
12
15
18
Ref. 1C
absolute frequency
boron content / μg g
-1
27 30 33 36 39 42 45
0
3
6
9
12
15
18
Ref. 1D
absolute frequency
boron content / μg g
-1
The boron contents determined in high-silicon and acid matrices are nearly 10%
higher than the average reference values from the interlaboratory comparison,
however, with a higher precision and accuracy at the same time. The slight deviations
is explained by the enormous scatter of the reference values as shown in Fig, 4. In
spite of these slight deviations, the t-Student test leads to a formal match between the
reference values and the found values.
The phosphorus contents found with the new method (Table 6) are in good
agreement with the averaged reference values of interlaboratory comparisons.
Nevertheless, with decreasing phosphorus content a decrease in the accuracy and
precision of analytical results was observed, as already found in the reference
materials.
Our lab participated in the two following interlaboratory comparisons [26, 27]
consisting of each three silicon samples of different boron and phosphorus
concentrations with the newly developed method. The results of the interlaboratory
comparisons after eliminating the outliers are compared in Table 7 with the results of
the analysis by ICP-OES measurements in high-silicon and acid matrices. All
measurements were quantified against a matrix matched calibration. With the
exception of phosphorus contents in Table 7 the n = 4 determined results are part of
the reference value of the interlaboratory comparisons on their own. The uncertainties
of the values reported in Table 7 are calculated by Gaussian error propagation over
the whole method.
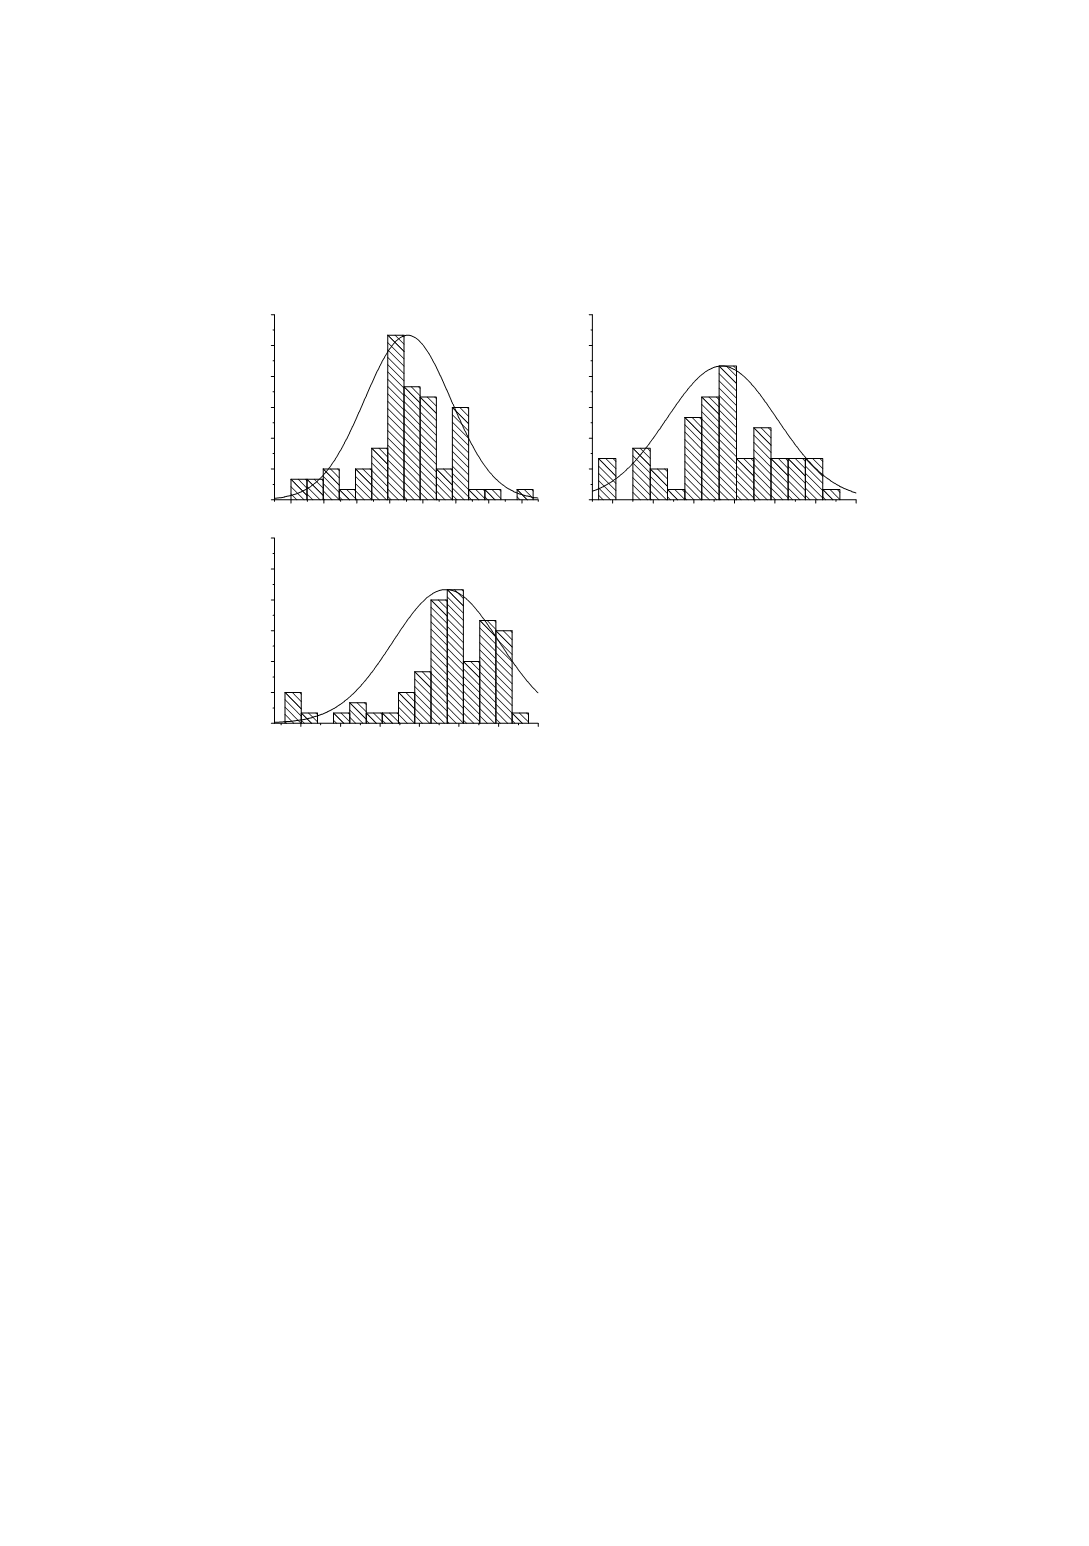
Figure 4
: Frequency diagrams of the
individual boron contents of the samples
Ref. 1A, Ref. 1b and Ref. 1c as
determined in the interlaboratory
comparison. The single values were
divided into 15 classes covering the span
from the minimum to the maximum
values obtained for each sample.
104