


 107 / 390

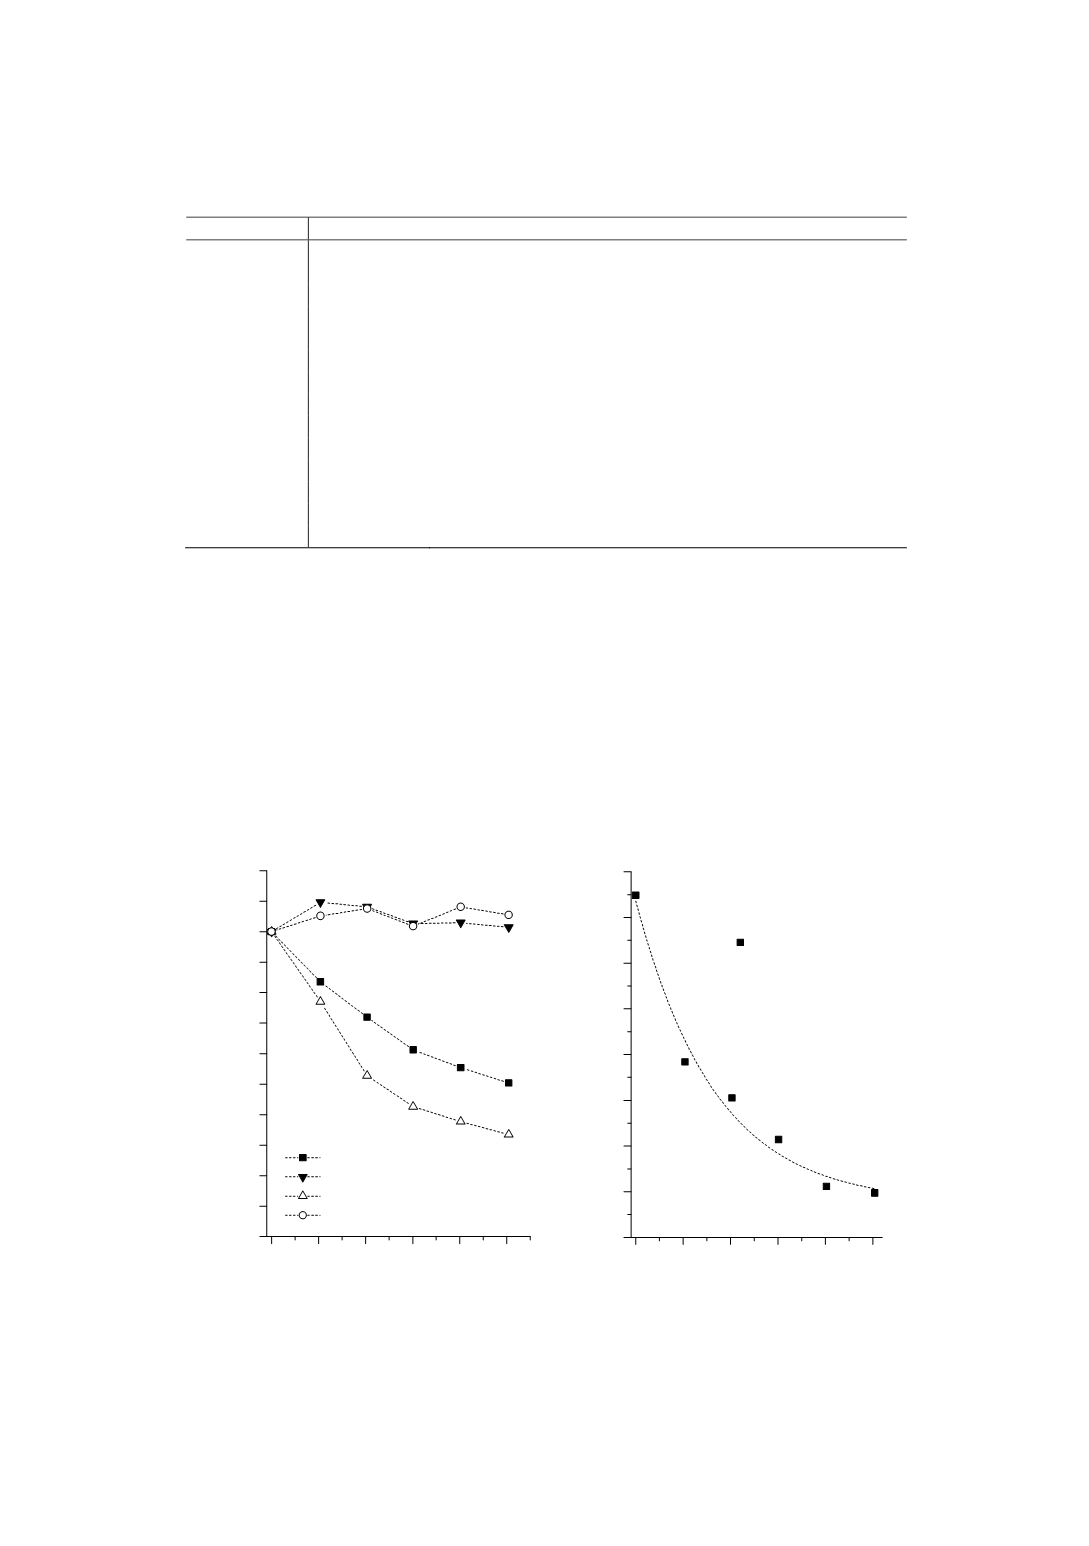
Table 2:
Selected analytical emission wavelength for ICP-OES, (I): atom emission, (II): ion
emission
element
analytical wavelength / nm
B
182.591 (I) / 182.641 (I)
/ 208.893 (I)
/ 208.959 (I) / 249.678 (I)
Mg
279.553 (II) / 280.270 (II)
/ 285.213 (I)
Al
237.312 (I) / 308.215 (I)
/ 309.271 (I)
/ 394.401 (I) / 396.152 (I)
P
177.495 (I) / 178.284 (I)
/ 178.766 (I)
/ 185.942 (I) / 213.618 (I)
Ca
315.887 (II) / 317.933 (II) / 393.366 (II)
Ti
334.941 (II) / 336.121 (II) / 337.280 (II) / 338.376 (II)
Cr
205.552 (II) / 206.149 (II) / 267.716 (II) / 283.563 (II)
Mn
257.610 (II) / 260.569 (II)
/ 279.482 (I) / 293.930 (II)
Fe
238.204 (II) / 239.562 (II) / 259.837 (II) / 259.940 (II) / 261.187 (II)
Ni
216.556 (II) / 231.604 (II)
/ 341.476 (I)
/ 352.454 (I)
Cu
204.379 (II) / 213.598 (II) / 224.700 (II)
/ 324.754 (I) / 327.396 (I)
Zr
327.305 (II) / 343.823 (II) / 349.621 (II)
Si
390.552 (I)
to control matrix stability
Ar
404.442 (I)
to control plasma stability
Results and discussion
ICP-OES performance and selection of analytical emission lines
The ICP-OES analysis in high-silicon and acidic matrices requires a reselection
and critical assessment of the analytical emission lines. To identify possible spectral
and non-spectral interferences originated by such matrices the silicon/acid
concentration in a multi-element standard solution (cf. Table 3) was increased
gradually from 0 to 5 mg g
-1
with the help of a method blank solution. With
increasing silicon and acid concentrations, a dramatic decrease of the signal-to-
background ratio was found for all emissions in the UV range, while the emissions in
the visible range are not significantly affected by the matrix.
0 1 2 3 4 5
2.70
2.75
2.80
2.85
2.90
2.95
3.00
3.05
3.10
0 1 2 3 4 5
0.0
0.1
0.2
0.3
0.4
0.5
0.6
0.7
0.8
0.9
1.0
1.1
1.2
B 182.641 nm
selectivity of boron emission / cts (ng g
-1
)
-1
Si / mg g
-1
Cr 206.149 nm (UV)
Cr 267.716 nm (VIS)
Ni 216.556 nm (UV)
Ni 341.476 nm (VIS)
rel. signal-to-background ratio
Si / mg g
-1
Figure 1
: Relative signal-to-background ratio of selected nickel and cobalt emission lines as a
function of silicon matrix concentration for standard solutions of 67 ng g
-1
Ni and 67 ng g
-1
Co
(left) and selectivity (given as slope of calibration function) of boron emission at 182.641 nm
as a function of silicon concentration, determined by calibrations from Table 3 (right).
99