


 111 / 390

(14.3 ± 0.2) ppm, the determination by ICP-OES only provided (10.6 ± 0.4) ppm
boron. Information about the sample preparation prior to the ICP-OES analysis was
not given. [1] As can be seen from Table 5 the boron concentration that was
determined exceeds the average certified value, while there is a match with the
content determined by PGAA. In 2015 a new certified value for boron of
(14.43 ± 0.27) ppm was published. This new value is based on a new PGAA
measurement and on a recent ICP-OES determination by Galler et al. [1], who
obtained a value of (15 ± 0.7) ppm by PGAA and (14.2 ± 0.6) ppm by ICP-OES. The
found boron contents for the IPT materials are not further discussed because there is
no certified value for the boron content.
The determined phosphorus contents match with the certified values. They show
absolute deviations from the certified contents of 5-10%, which is not least because of
the complex spectral and non-spectral background interferences in ICP-OES analysis
(see. Fig. 2) so that the obtained confidence intervals (include precision and accuracy)
are partly significantly above 5%.
Interlaboratory comparisons
Due to the described complex problems for a correct determination of boron in
silicon and the absence of certified or verified reference values round robin tests for
analysis of boron in silicon samples were initiated by Dr. Gilles Humbert from
FerróPem (France). Between 17-22 laboratories participated in each test [25-27]. Each
round robin test included four silicon samples with different concentrations of boron,
wherein each one of the samples had a boron content < 1 ppm, which is below the
detection capability of the proposed method (cf. LOQ). The evaluation of the
laboratory comparisons was carried out in accordance with DIN-ISO 5725-2 [28].
First, the three silicon samples with different boron concentrations of the first
round robin test were analysed by the new method and the results validated against
the values obtained in the first interlaboratory comparison [25]. Table 6 compares the
numerical results of the first interlaboratory comparison [25] with results obtained by
the new method.
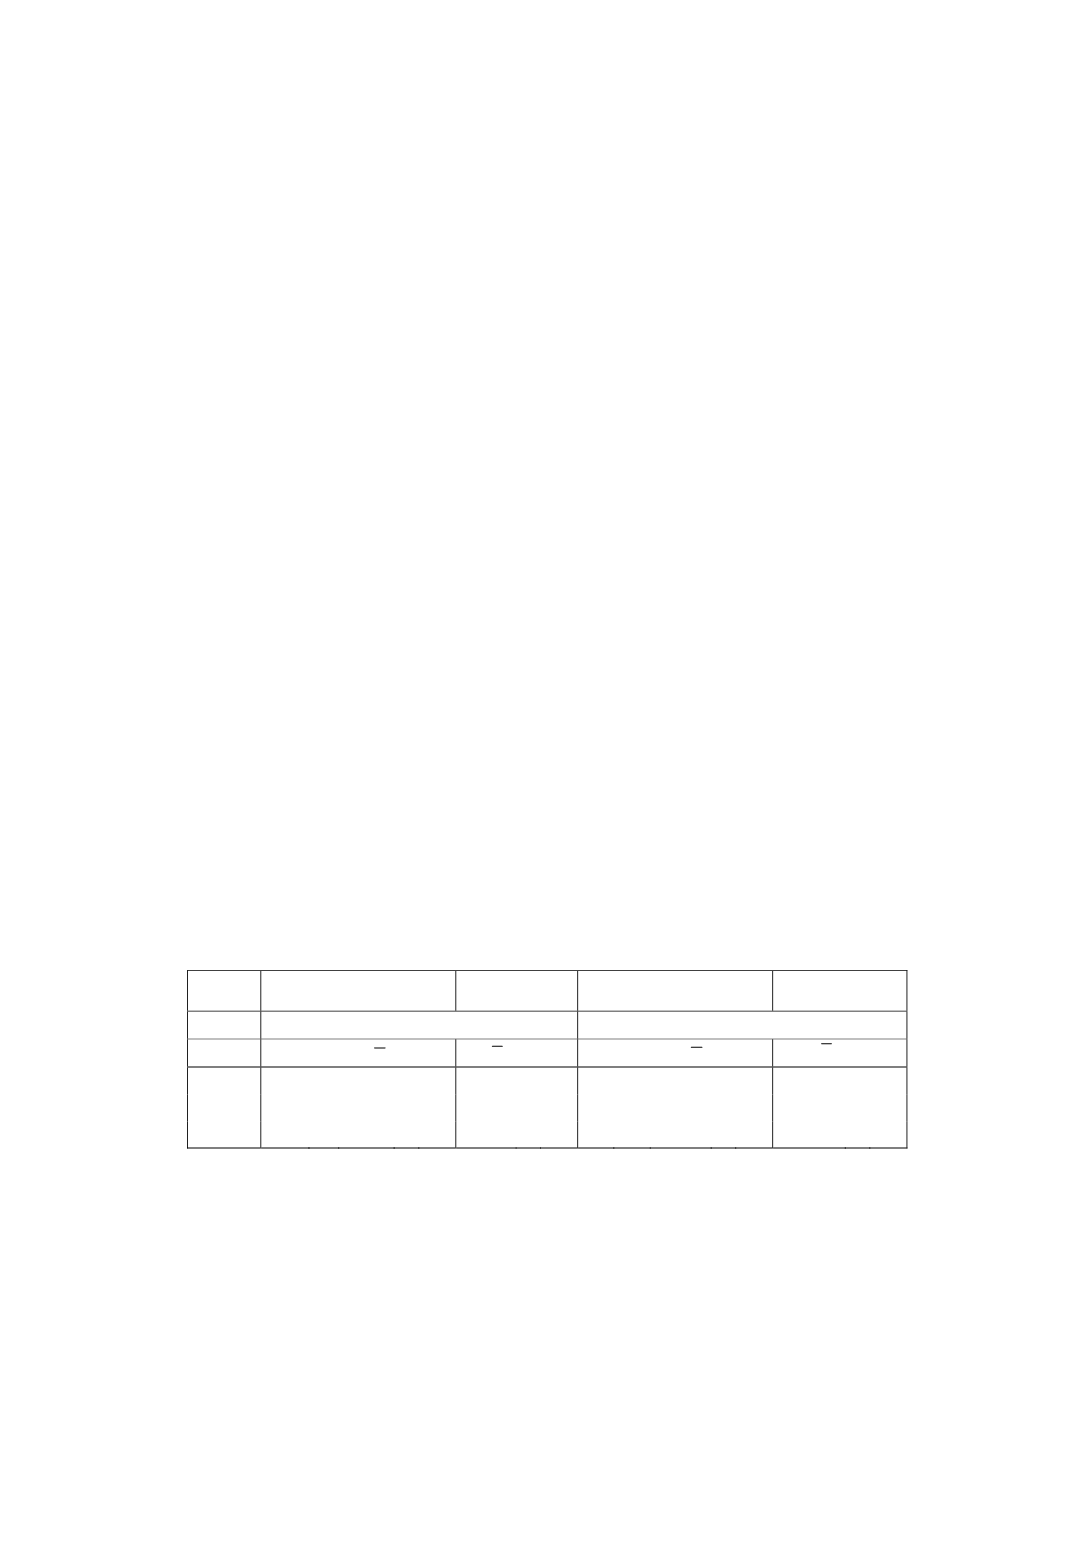
Table 6:
Reference values of boron an phosphorus determination as result of laboratory
comparison after critical assessment [25] according to results obtained in high-silicon and
acid matrix and quantified by matrix matched calibration, n = 4
reference values
results of lab comparison
found values
by MMC
reference values
results of lab comparison
found values
by MMC
boron contents
phosphorus contents
p' n'
′
Z
/ μg g
-1
Z
/ μg g
-1
p' n'
′
Z
/ μg g
-1
Z
/ μg g
-1
Ref. 1A
16* 64
12.4
± 1.3
13.5
± 0.4 9* 36
68.4
± 5.7
69.7
± 3.7
Ref. 1C
17 68
41.4
± 2.7
43.8
± 0.7 10 40
29.8
± 2.9
31.1
± 2.2
Ref. 1D
17 68
38.0
± 4.1
41.1
± 0.6 10 40
17.3
± 2.1
15.9
± 1.0
Additionally, all individual results of boron contents obtained in the interlaboratory
comparisons are shown as frequency diagrams in Fig. 4. The distance between the
minimum and the maximum boron content of each sample was divided into 15
equidistant classes.
Particularly for boron (Fig. 4) it becomes apparent that only the single results in the
low-boron-doped sample reference 1A show a pattern that is fairly similar to that of a
t-distribution. Significantly different are the scattering patterns of the samples with
levels around 40 ppm of boron, which are not t-distributed and therefore are not
103