


 108 / 390

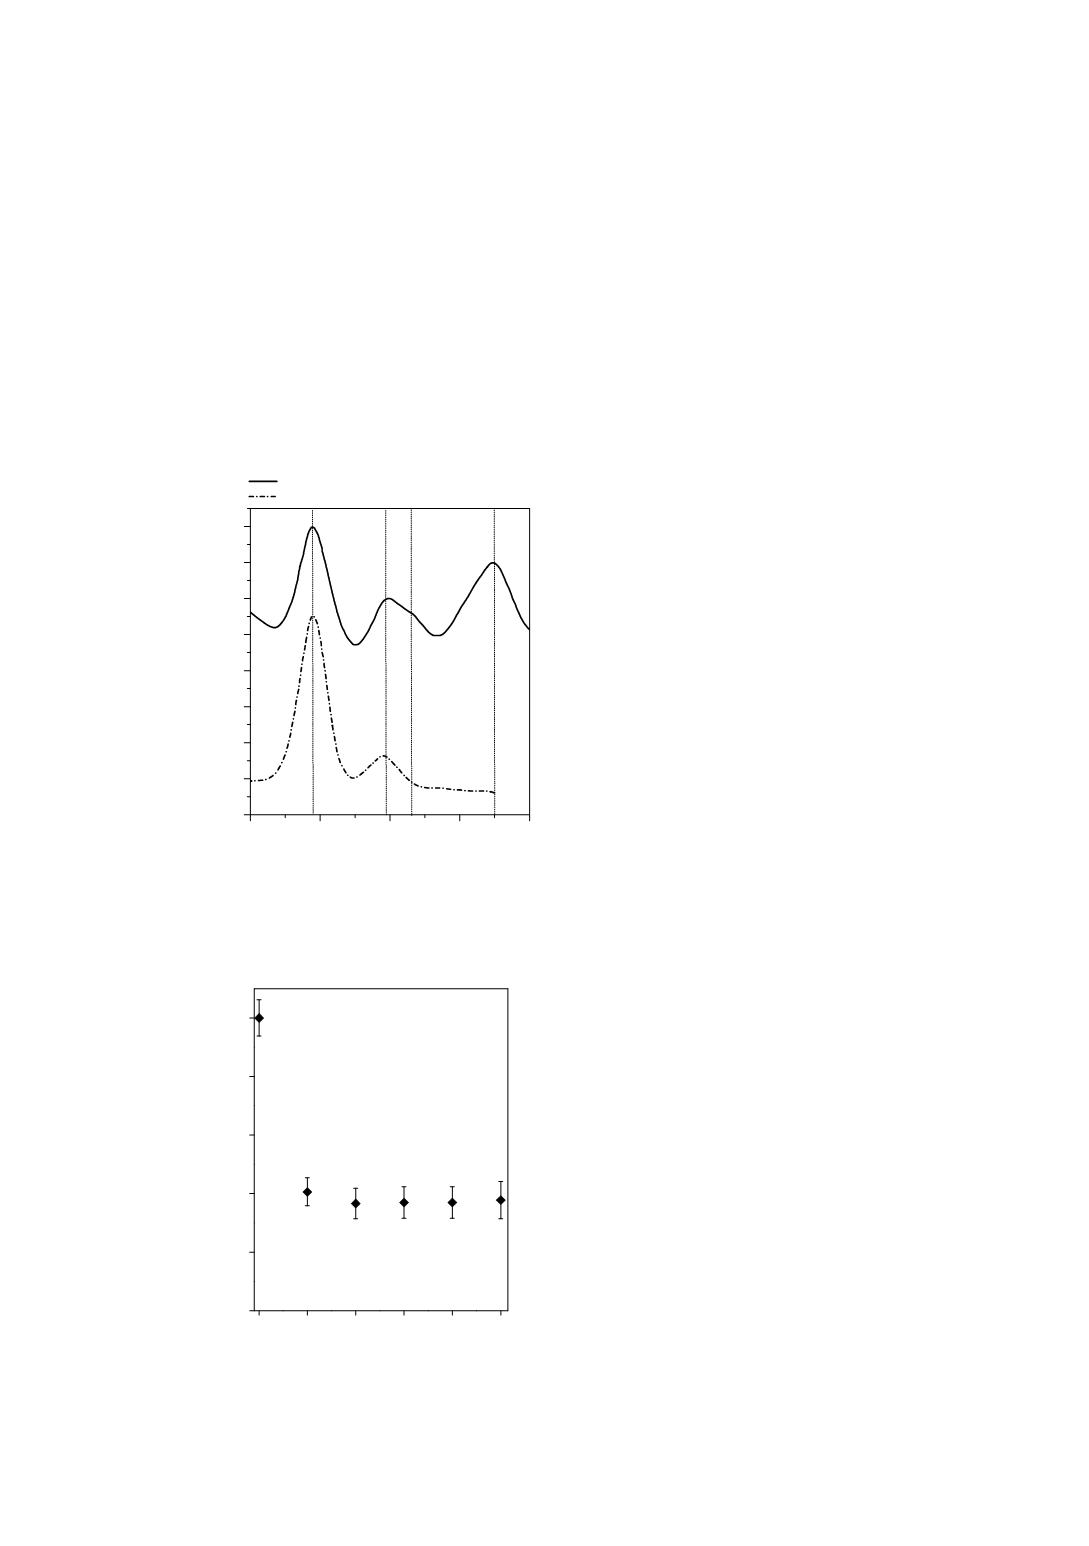
Fig. 1 left, illustrates this in the case of selected nickel and cobalt emissions; the
signal-to-background ratio is represented relatively to that of a silicon-free solution. In
particular for the non-metals boron and phosphorus, which exclusively show atomic
emissions with sufficient intensity in the UV range, a decrease in selectivity with
increasing silicon and acid matrix was found. (Fig.1, right)
Additionally, the high-silicon content complicated the determination of phosphorus
in the analysis solutions by spectral interferences as shown in Fig. 2. Apart from the
interference of copper with the most intensive phosphorus emission lines 177.495 nm
and 213.618 nm, an additional direct interference with silicon at 213.618 nm was
observed (Fig. 2). A determination of phosphorus in the required concentration range
is not possible solely by matrix matching of the calibration standards.
213.58 213.60 213.62 213.64 213.66
400
500
600
700
800
900
1000
1100
1200
silicon matrix
silicon matrix
copper
sample with 2 mg g
-1
Si
sample without Si
intensity / cts
wavelength / nm
phosphorus
After careful assessment regarding spectral and non-spectral interferences between
the matrix and the analyte element emission lines, the most suitable emission lines for
the analytical determination of metals and non-metals in high-silicon and acid
matrices are summarized in Table 2.
0 1 2 3 4 5
0.5
0.6
0.7
0.8
0.9
1.0
rel. intensity ration of MgII/MgI
Si / mg g
-1
Figure 3
: Relative intensity ratio between
Mg ion emission at 280.270 nm and Mg
atom emission at 285.213 nm of
magnesium normalized to the MgII/MgI
intensity ratio of the silicon free solution
Figure 2
: Comparison of spectra
between
a silicon-free calibration solution (50 ppb
Cu, 80 ppb P) and a real sample matrix
with 2 mg g
-1
silicon matrix (25 ppb Cu, 60
ppb P).
100