


 109 / 390

Another important contribution to the quality of the analytical measurements in
such high-silicon and acid matrices is plasma stability. The stability control was
performed by means of the scattering of the measured Ar emission intensities [21]
both as short-term stability (internal measurement replications) as well as long-term
stability (series of measurements). Furthermore, there was a permanent monitoring of
the intensity ratio MgII /MgI, which indicates changes in the excitation conditions
with increasing silicon and acid matrix. [21-23] Fig. 3 shows that the characteristic
value of the robust plasma decreased by adding a silicon content of 1 mg g
-1
by
approximately 30%, whereas with further increasing silicon content in the analyte
solution (1 mg g
-1
to 5 mg g
-1
Si) the intensity ratio MgII/MgI remained constant, so
that identical excitation conditions prevailed over a variable range of the Si contents.
A stable analytical plasma could be approved in measurements with 2 mg g
-1
silicon
matrix over a time of 6 hours.
Limits of quantification
For the assessment of the method, the detection and quantification limits were
calculated using the calibration method according to DIN 32 645 [29]. Compared to
the blank value method the calibration function method provides not the smallest
limits, but it provides the more realistic picture of actually determinable
concentrations. The limitations of the calibration method depended on the selected
range of operation. For their determination under varying silicon matrix
concentrations an 8-point multi-element calibration with identical concentrations in
equidistant intervals was performed for each. The average concentrations of the
calibration functions are shown in Table 3.
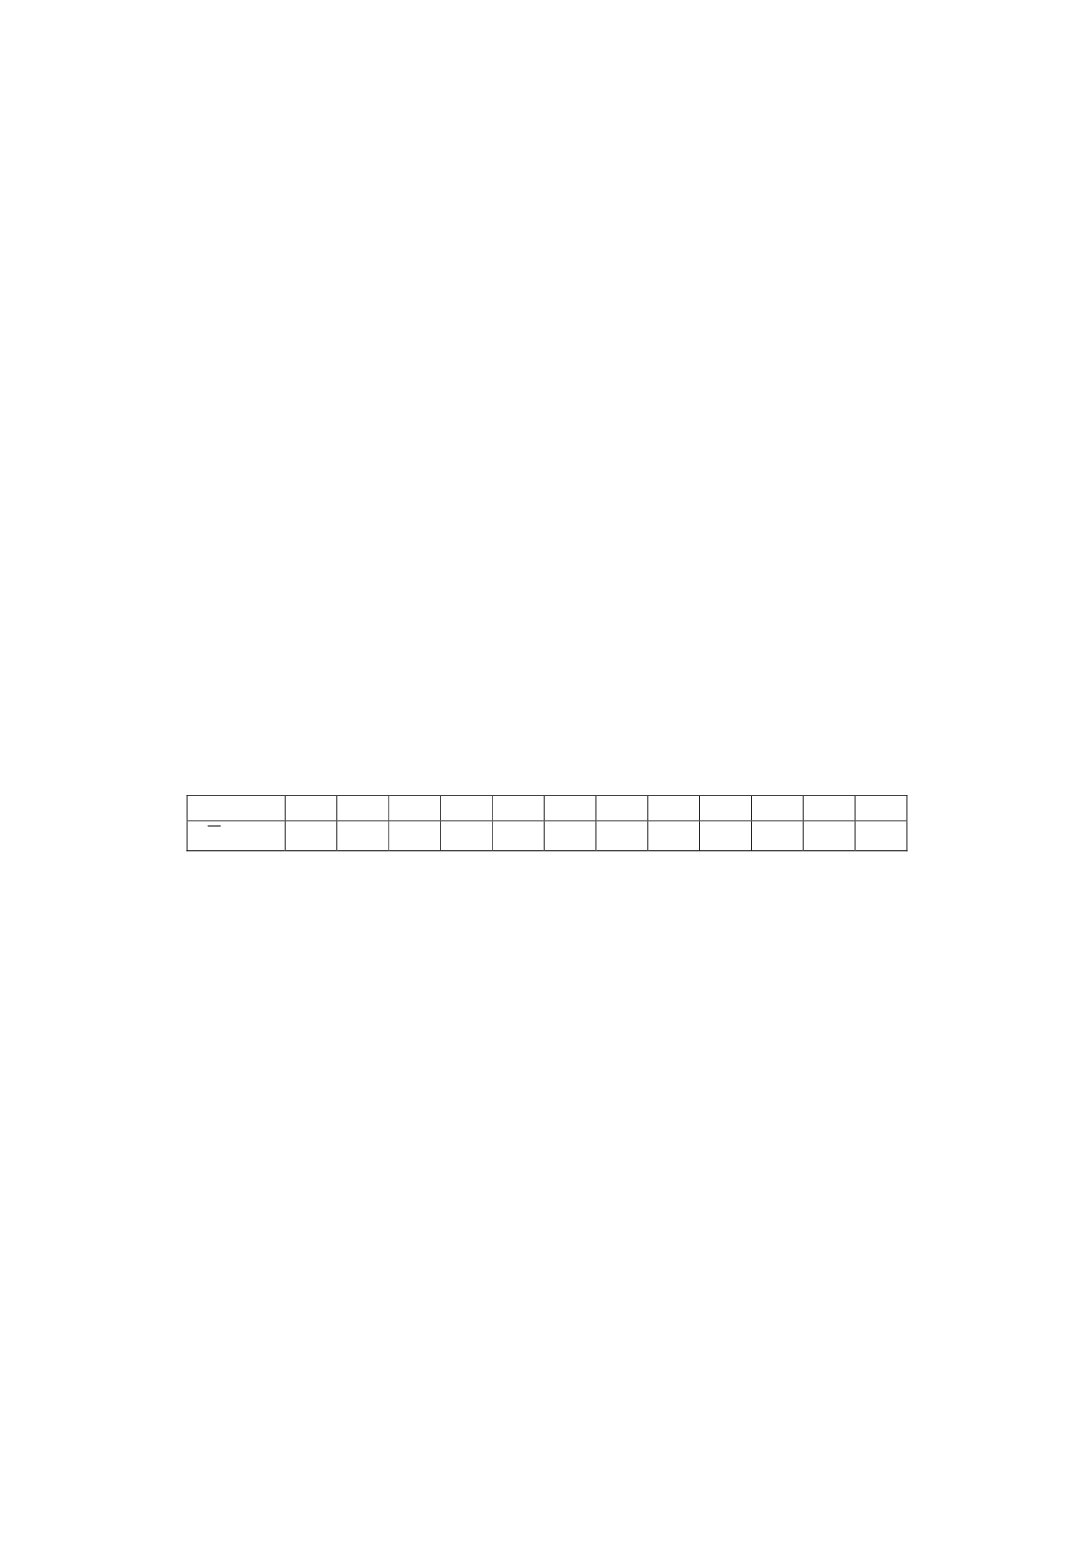
Table 3
Average concentrations of calibration functions to determine LOQ
element
B
Mg
Al
P
Ca
Ti
Cr
Mn
Fe
Ni
Cu
Zr
w
/ ng g
-1
70
35
140 35
140
70
35
35
140
35
35
35
Consequently, the limit of quantification of the method is co-determined by the
quality of each performed calibration by means of the residual standard deviation. All
limits were calculated for the significance level
Į
= 0.01. To calculate limits of
quantification an uncertainty of 10% (k = 10) was chosen.
Due to the decreasing signal-to-background ratio of the emissions in the UV range
with increasing silicon concentration a minimum limit of quantification at a silicon
concentration of 4 mg g
-1
in analytical solution was obtained. With further increasing
silicon content the limit of quantification increased again due to the non-spectral
interference.
In consequence, the lowest limits of quantification for the multi-element analysis
of 12 elements shall be determined in solution of 4 mg g
-1
silicon. A further increase
of the matrix would lead only for a few emission lines to a slight, but not significant
improvement in detection capability. Table 4 shows the minimally achievable limits
of quantification by measuring a solution with a matrix of 4 mg g
-1
Si.
Assuming a similar distribution of elements, a maximum purity level of silicon of
99.996% can be definitely analysed by measuring against a correspondingly matrix-
matched calibration. In comparison the classical method, including the time-
consuming volatilization of the high-silicon and acid matrix, allows the determination
of silicon with a purity of 99.998% for identical conditions. [10]
101