


 110 / 390

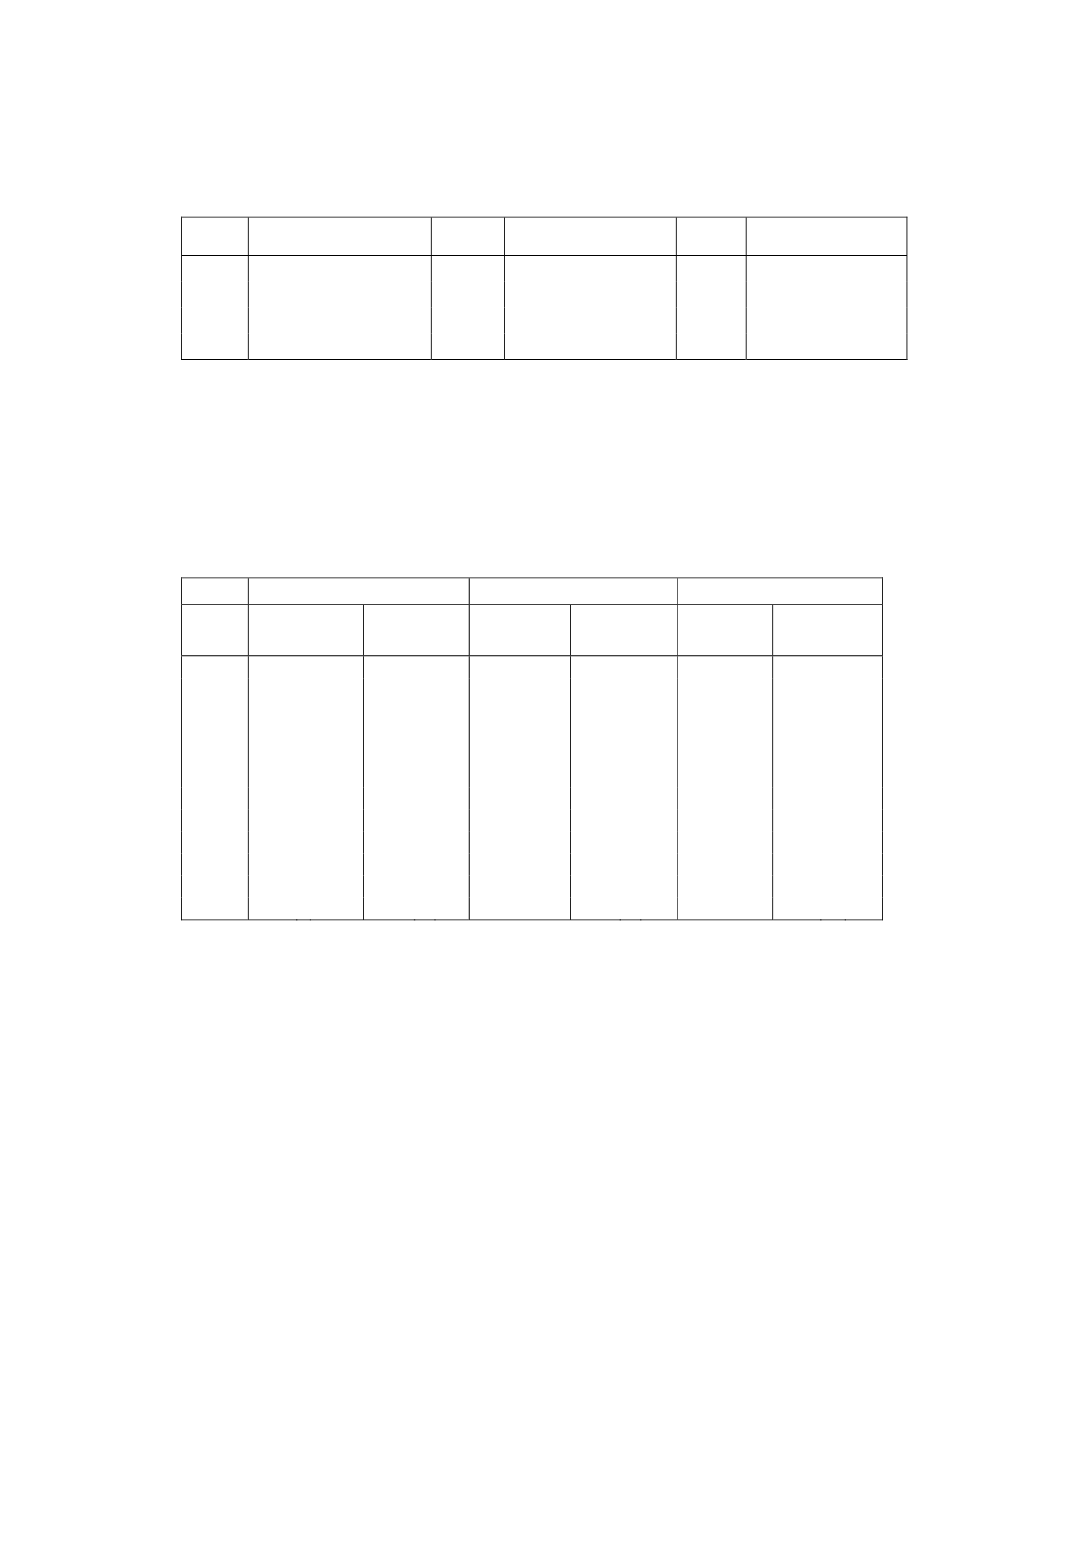
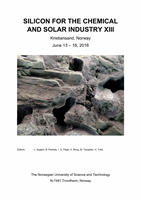
Table 4
Minima of LOQ (k = 10) calculated from calibration functions of multi-element
standard solutions with 4 mg g
-1
Si, all analytical wavelengths measured in axial viewing
element
wavelength /
nm
w
LOQ
/
μg g
-1
element
wavelength /
nm
w
LOQ
/
μg g
-1
element
wavelength
/ nm
w
LOQ
/
μg g
-1
B
182.641
2.96
Ca
317.933
15.2
Fe
239.556
4.13
Mg
285.213
1.20
Ti
334.941
0.71
Ni
216.556
1.47
Al
308.215
3.92
Cr
205.552
1.79
Cu
324.754
1.83
P
185.942
5.00
Mn
257.610
0.31
Zr
349.621
0.46
Comparison with certified reference materials
Table 5 compares the values of the certified reference materials (SRM 57b IPT134,
IPT135) with the analytical results obtained by the new microwave-assisted digestion
procedure with ICP-OES measurements against a matrix matched calibration (MMC).
Table 5:
Comparison between impurity contents in certified reference materials and results
obtained by the new developed microwave-assisted procedure measured in high-silicon
matrix and quantified by MMC; n = 5; all units are μg g
-1
NIST SRM 57b
IPT 134
IPT 135
element
certified
value
found value
certified
value
found value
certified
value
found value
B
(12.5
±
2.1)* 13.4 ± 0.6
not certified
6.6 ± 0.8
not certified
7.4 ± 0.5
Mg
not certified
2.4 ± 0.2
48
±
3 49.9 ± 0.9
12
±
1 11.9 ± 0.2
Al
1690
±
220 1551 ± 53
850
±
30
842 ± 23 450
±
30 377 ± 16
P
16.3
±
1.5 15.6 ± 1.2
33
±
2 31.0 ± 2.3
27
±
1 24.3 ± 2.1
Ca
22.2
±
4.5 21.0 ± 6.9 1020
±
30 1026 ± 21 110
±
10 113 ±
7
Ti
346
±
49
329 ±
7
97
±
4
100 ±
2 113
±
4 119 ±
2
Cr
17.3
±
3.3 14.7 ± 0.4
11
±
1
9.0 ± 0.4
6
±
1
4.9 ± 0.1
Mn
78.2
±
7.2 70.0 ± 1.5
113
±
5
101 ±
1
70
±
3 65.5 ± 0.4
Fe
3400
±
60 3294 ± 45 2900
±
100 2828 ± 26 1250
±
30 1280 ± 16
Ni
15.3
±
1.7 15.6 ± 0.7
6
±
1
4.9 ± 0.6
5
±
1
3.6 ± 0.3
Cu
17.2
±
5.8 22.8 ± 0.5
14
±
2 15.8 ± 2.3
8
±
1
8.6 ± 0.4
Zr
17.8
±
0.6 17.5 ± 0.4
not certified
5.8 ± 0.1
not certified
4.4 ± 0.1
* in 2015 a new certified value for boron was published from NIST: (14.43 ± 0.27) ppm
According to the International Conference of Harmonization [24] two analytical
values are in agreement if their distance does not exceed ± 10%. However, this
approach was considered as impractical in the present case since the confidence
intervals for some of the certified element contents are well above 20%. Therefore,
the assessment of conformity between the found and certified values, including their
confidence intervals, was done in accordance to the t-Student test. The precision is
interpreted as repeatability that should be significantly less than 5% for n
3
analyses.
For all investigated silicon samples the determination of metal impurities in the
high-silicon and acid matrices turned out to be uncomplicated. Only for low-calcium
concentrations (NIST 57b) a reduced repeatability was found, which was already
indicated in the broad confidence interval of the certified value. In previous studies, it
was found that the decreased repeatability due to low calcium levels can be traced
back to a blank value problem [10].
Special attention was given to the validation of the boron contents. The certified
boron content of SRM 57b was derived from measurements using two different
methods. While the solid analysis by PGAA provided a boron content of
102