


 25 / 36

25
Position paper - CenSES 1/2015
Position Paper: CenSES Energy demand projections towards 2050
23
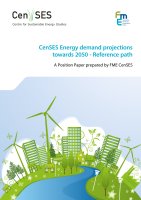
Figure 15 Energy use in transport in 2010 (TWh)
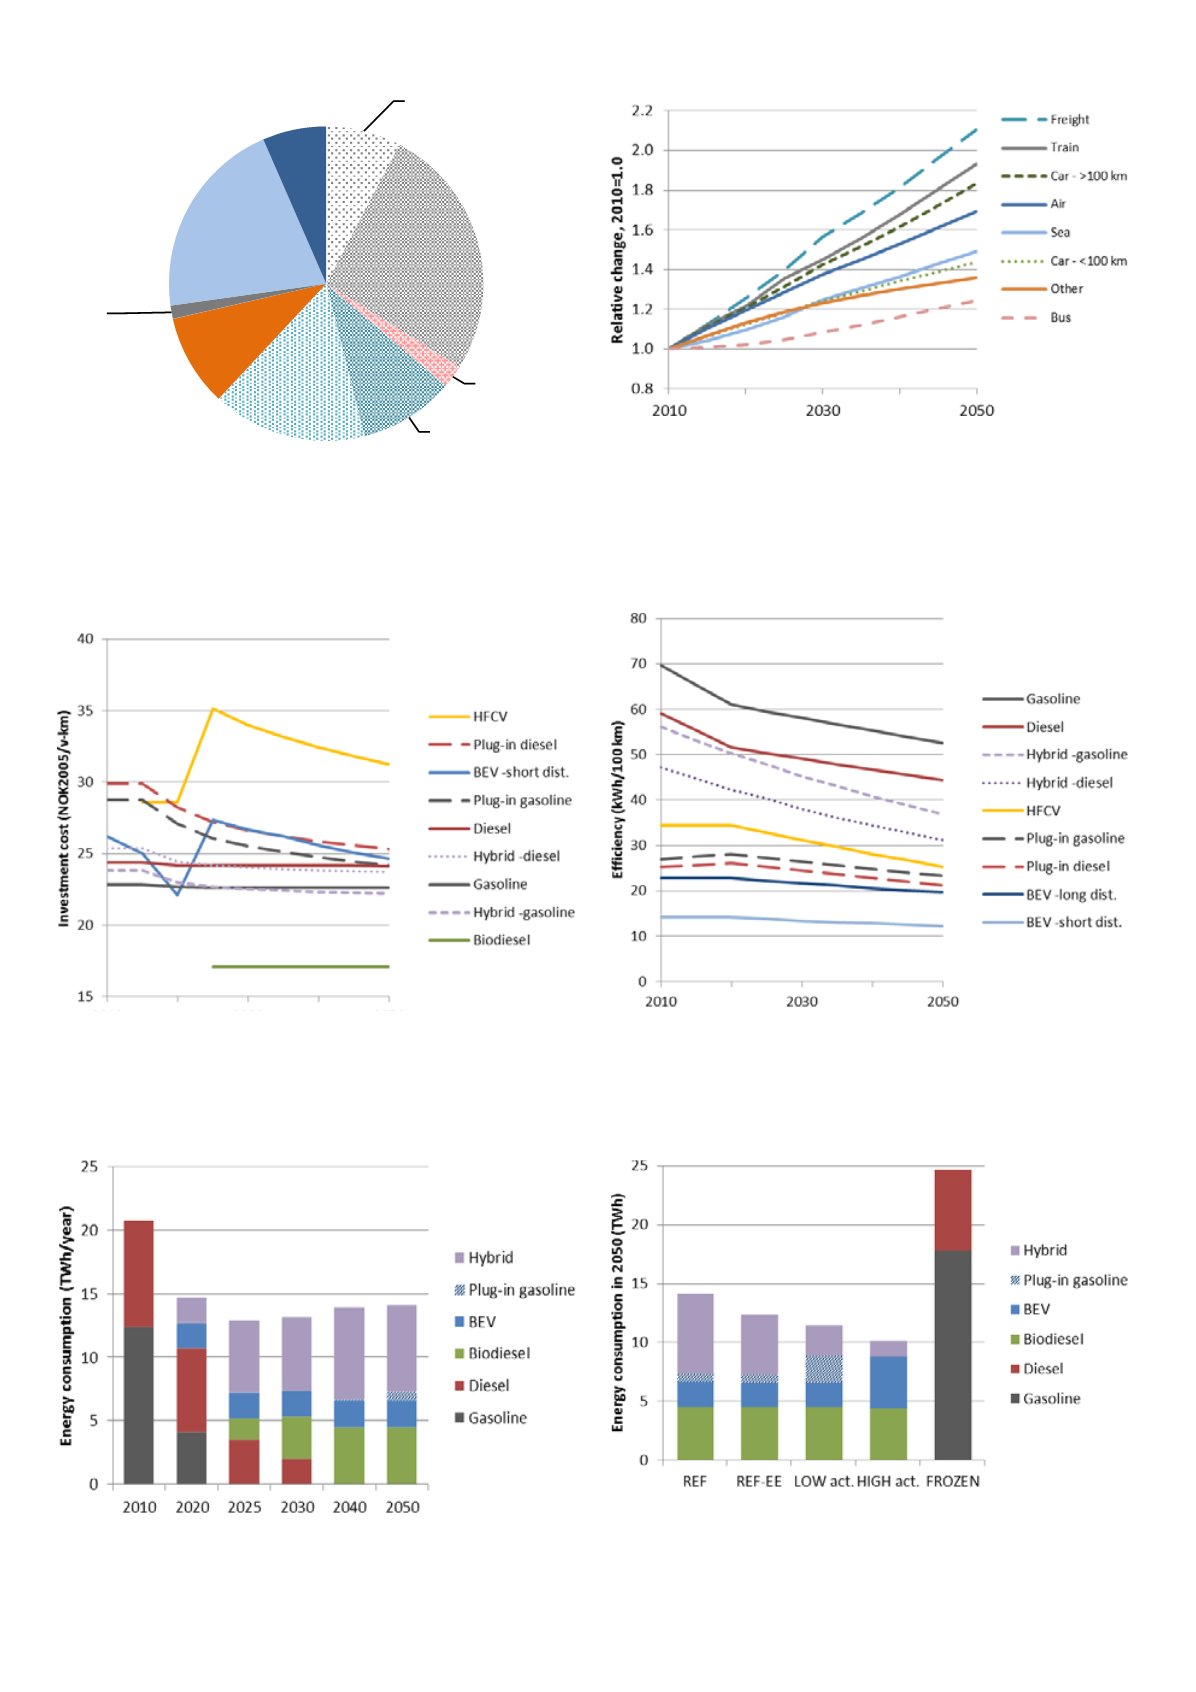
Figure 16 Relative development of different types of
transportation, 2010-2050
Figure 17 Development of investment costs, incl. taxes,
for different types of cars (kNOK2005/Mvkm)
Figure 18 Development in cars efficiencies (kWh/100 km
)
Figure 19 Energy use by cars in the reference path, 2010-
2050 (TWh/year)
Figure 20 Comparison of energy use by cars in the
analysed scenarios in 2050 (TWh/year)
Car - >100
km
5 TWh
Car - <100
km
16 TWh
Bus
1 TWh
Delivery
truck
6 TWh
Trailer
10 TWh
Other
6 TWh
Train
1 TWh
Sea
13 TWh
Air
4 TWh
Figure 15 Energy use in transport in 2010 (TWh)
Figure 16 Rel tive development of different types of
transportation, 2010-2050
Figure 17 Development of investment costs, incl. taxes,
for different types of cars (kNOK2005/Mvkm)
Figure 18 Development in cars efficiencies (kWh/100 km
)
Figure 19 Energy use by cars in the reference path, 2010-
205 (TWh/year)
Figure 20 Comparison of energy use by cars in the
analysed scenarios in 2050 (TWh/year)
Car - >100
km
5 TWh
Car - <100
km
16 TWh
Bus
1 TWh
Delivery
truck
6 TWh
Trailer
10 TWh
Other
6 TWh
Train
1 TWh
Sea
13 TWh
Air
4 TWh
Figure 15 Energy use in transport in 2010 (TWh)
Figure 16 Relative development of different types of
transportation, 2010-2050
Figure 17 Development of investment costs, incl. taxes,
for different types of cars (kNOK2005/Mvkm)
Figure 18 Development in cars efficiencies (kWh/100 km
)
Figure 19 Energy use by cars in the reference path, 2010-
2050 (TWh/year)
Figure 20 Comparison of energy use by cars in the
analysed scenarios in 2050 (TWh/year)
Car - >100
km
5 TWh
Car - <100
km
16 TWh
Bus
1 TWh
Delivery
truck
6 TWh
Trailer
10 TWh
Other
6 TWh
Train
1 T h
Sea
13 TWh
Air
4 TWh
ositi n Paper: CenSES nergy demand projections to ar s
23
igure 15 Energy use in transport in 2010 (TWh)
Figure 16 Relative development of different types of
transportation, 2010-2050
igure 17 Development of investment costs, incl. taxes,
or different types of cars (kNOK2005/Mvkm)
Figure 18 Development in cars efficiencies (kWh/100 km
)
igure 19 Energy use by cars in the reference path, 2010-
050 (TWh/year)
Figure 20 Comparison of energy use by cars in the
analysed scenarios in 2050 (TWh/year)
Car - >100
km
5 TWh
Car - <100
km
16 TWh
Bus
1 TWh
Delivery
truck
6 TWh
Trailer
10 TWh
Other
6 TWh
Train
1 TWh
Sea
13 TWh
Air
4 TWh
Figure 15 Energy use in transport in 2010 (TWh)
Figure 16 Relative development of different types of
transportation, 2010-2050
Figure 17 Dev lop nt of investment costs, incl. taxes,
for different types of cars (kNOK2005/Mvkm)
Figur 18 Development in cars efficiencies (kWh/100
Figure 19 Energy use by cars in the reference path, 2010-
Figure 20 Comparison of energy use by cars in the
Car - >100
km
5 TWh
Car - <100
km
16 TWh
Bus
1 TWh
Delivery
truck
6 T h
Trailer
10 TWh
Other
6 TWh
Train
1 TWh
Sea
13 TWh
Air
4 TWh
Figure 15
Energy use in transport in 2010 (TWh)
Figure 16
Relative development of different types of
transportation, 2010-2050
Figure 17
Development of investment costs, incl. taxes, for
diff rent types of cars (kNOK2005/Mvkm)
Figure 18
Development in cars efficiencies (kWh/100 km)
Figure 19
Energy use by
in the ref r nce path, 2010-2 5
(TWh/year)
Figure 20
Co rison of en rgy use by cars in the analysed scenarios
in 2050 (TWh/year)