


 29 / 36

29
Position paper - CenSES 1/2015
9 Energy service demand and final energy consumption in the reference path
Energy service demand
Final energy consumption («purchased»)
2010 2030 2050 Unit Change 2010-2050 2010 2030 2050 Unit Change 2010-2050
ry sector
3.2 3.9 4.3 TWh
+34% 3.2 3.9 4.3 TWh
+ 38%
truction
1.6 2.0 2.2 TWh
+38% 1.6 2.0 2.2 TWh
+38%
ce
30.5 32.0 35.2 TWh
+15% 29.3 31.3 36.1 TWh
+23%
ential
44.0 51.1 55.3 TWh
+26% 46.5 50.2 52.0 TWh
+12%
try
77.7 78.1 78.1 TWh
+1% 80.7 78.9 78.7 TWh
-2%
stationary
157.0 167.1 175.1 TWh
+11% 161.3 166.3 173.4 TWh
+8%
enger cars 32.3 41.5 49.4 Bv-km
+53% 20.8 13.2 13.9 TWh
-33%
s
0.64 0.69 0.79 Bv-km
+24% 1.4 1.5 1.7 TWh
+19%
s
12.2 19.1 25.7 Bv-km
+108% 15.8 21.6 29.2 TWh
+85%
transport
23.4 29.7 35.3 TWh
+50% 23.4 29.7 35.3 TWh
+ 51%
energy
223 232 253 TWh
+14 %
21 Statistical final energy consumption 1990-2013
ojection of final energy consumption of analysed
ios 2010-2050 (TWh/year)
Figure 22 Statistical electricity consumption 1976-2013
and projection of electricity consumption of analysed
scenarios 2010-2050 (TWh/year)
23 Power production and net electricity trade
2050 in the reference path (TWh/year)
Figure 24 Net power trade with neighbouring countries
in the different scenarios in 2020-2050 (TWh/year)
Position Paper: CenSES Energy demand projections towards 2050
27
Table 9 Energy service demand and final energy consumption in the reference path
Energy service demand
Final energy consumption («purchased»)
2010 2030 2050 Unit Change 2010-2050 2010 2030 2050 Unit Change 2010-2050
Primary sector
3.2 3.9 4.3 TWh
+34% 3.2 3.9 4.3 TWh
+ 38%
Construction
1.6 2.0 2.2 TWh
+38% 1.6 2.0 2.2 TW
+38%
Se vice
30.5 32.0 35.2 TWh
+15% 29.3 31.3 36.1 TW
+23%
Residential
44.0 51.1 55.3 TWh
+26% 46.5 50.2 52.0 TWh
+12%
Industry
77.7 78.1 78.1 TWh
+1% 80.7 78.9 78.7 TWh
-2%
Sum stationary
157.0 167.1 175.1 TWh
+11% 161.3 166.3 173.4 TWh
+8%
Passenger cars 32.3 41.5 49.4 Bv-km
+53% 20.8 13.2 13.9 TWh
-33%
Buses
0.64 0.69 0.79 Bv-km
+24% 1.4 1.5 1.7 TWh
+19%
Trucks
12.2 19.1 25.7 Bv-km
+108% 15.8 21.6 29.2 TWh
+85%
Other transport
23.4 29.7 35.3 TWh
+50% 23.4 29.7 35.3 TWh
+ 51%
Total energy
223 232 253 TWh
+14 %
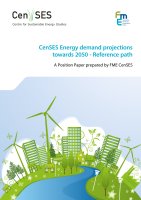
Figure 21 Statistical final energy consumption 1990-2013
and projection of final energy consumption of analysed
scenarios 2010-2050 (TWh/year)
Figure 22 Statistical electricity consumption 1976-2013
and projection of electricity consu ption of analysed
scenarios 2010-2050 (T h/y r)
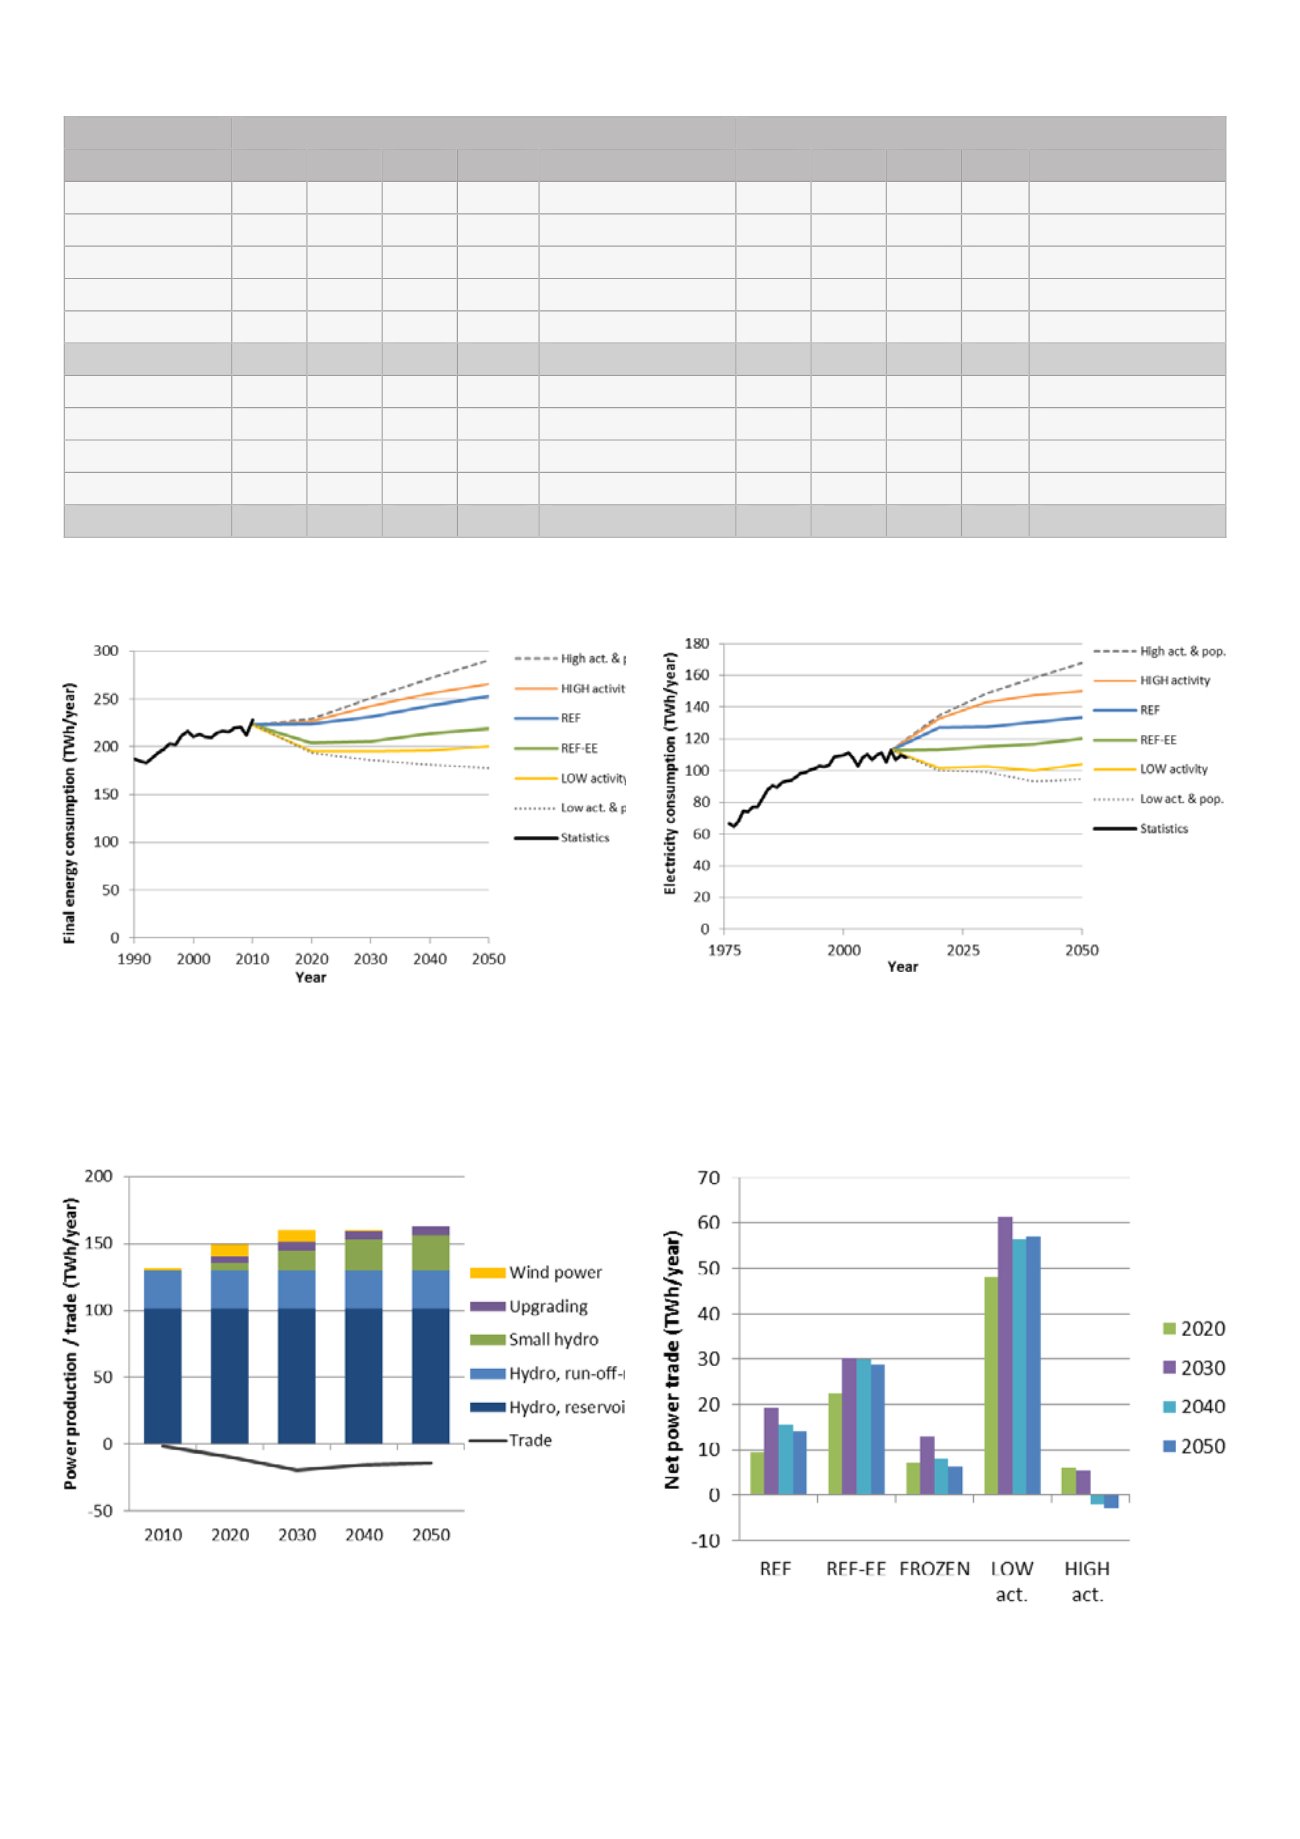
Figure 23 Power production and net electricity trade
2010-2050 in the reference path (TWh/year)
Figure 24 Net power trade with neighbouring countries
in the different scenarios in 2020-2050 (TWh/year)
Position Paper: CenSES Energy demand projections towards 2050
27
Table 9 Energy service demand and final energy consumption in the reference path
Energy service demand
Final energy consumption («purchased»)
2010 20 0 2050 Unit Change 2010-2050 2010 2030 2050 Unit Change 2010-2050
Primary sector
3.2 3.9 4.3 TWh
+34% 3.2 3.9 4.3 TWh
+ 38%
Construction
1.6 2.0 2.2 TWh
+38% 1.6 2.0 2.2 TWh
+38%
Service
30.5 32.0 35.2 TWh
+15% 29.3 31.3 36.1 TWh
+23%
Residential
44.0 51.1 55.3 TWh
+26% 46.5 50.2 52.0 TWh
+12%
Industry
77.7 8.1 78.1 T h
+1% 80.7 78.9 78.7 TWh
-2%
Sum stationary
157.0 167.1 175.1 TWh
+11% 16 .3 166.3 173.4 TWh
+8%
Pass nge cars 32.3 41.5 49.4 v-
+53% 20.8 13.2 13.9 TWh
-33%
Buses
0.64 0.69 0.79 Bv-
+24% 1.4 1.5 1.7 TWh
+19%
Trucks
12.2 19.1 25.7 Bv-k
+108% 15.8 21.6 29.2 TWh
+85%
Other transport
23.4 29.7 35.3 TWh
+50% 23.4 29.7 35.3 TWh
+ 51%
Total energy
223 232 253 TWh
+14 %
Figure 21 Statistical final energy consumption 1990-2013
and projection of final energy consumption of analysed
scenarios 2010-2050 (TWh/year)
Figure 22 Statistical electricity consumption 1976-2013
and projection of electricity consumption of analysed
scenarios 2010-2050 (TWh/year)
Figure 23 Power production and net electricity trade
2010-2050 in the reference path (TWh/year)
Figure 24 Net power trade with neighbouring countries
in the different scenarios in 2020-2050 (TWh/year)
Position Paper: CenSES Energy demand projections towards 2050
27
Table 9 Energy service demand and final energy consumption in the reference path
Energy service demand
Final energy consumption («purchased»)
2010 2030 2050 Unit Change 2010-2050 2010 2030 2050 Unit Change 2010-2050
Primary sector
3.2 3.9 4.3 TWh
4
3.2 3
4.3 TWh
+ 38%
Construction
1.6 2.0 2.2 TWh
+38
1.6 2.0 2.2 TWh
+38%
Service
30.5 32.0 35.2 TWh
+15% 29.3 31.3 36.1 TWh
+23%
Residential
44.0 51.1 55.3 TWh
+26% 46.5 50.2 52.0 TWh
+12%
Industry
77.7 78.1 78.1 TWh
+1% 80.7 78.9 78.7 TWh
-2%
Sum stationary
157.0 167.1 175.1 TWh
+11% 161.3 166 3 173.4 TWh
+8%
Passenger cars 32.3 41.5 49.4 Bv-km
+53% 20.8 13.2 13.9 TWh
-33%
Buses
0.64 0.69 0.79 Bv-km
+24
1.4 1.5 1.7 TWh
+19%
Trucks
12.2 19.1 25.7 Bv-km
15.8 21.6 29.2 TWh
+85%
Other transport
23.4 29.7 5.3 TWh
23.4 29.7 35.
TWh
+ 51%
Total energy
2 3 23 253 TWh
+14 %
Figure 21 S atistical final energy consumption 1990-2013
and projection of final energy consumption of analysed
scenarios 2010-2050 (TWh/ ear)
Figure 2 Statistical electricity consumption 1976-2013
and projection of electricity consumption of analysed
scenarios 2010-2050 (TWh/year)
Figure 23 Power production and net lectricity trade
2 10-2 50 in the r f rence path (TWh/year)
Figure 24 Net power trade with neighbouring countries
in the different scenarios in 2020-2050 (T h/year)
Position Paper: CenSES Energy demand projections towards 2050
27
Table 9 Energy service demand and final e ergy consumption in the reference path
Energy service demand
Final energy consumption («purchased»)
2010 2030 2050 Unit Change 2010-2050 2010 2030 2050 Unit Change 2010-2050
Primary sector
3.2 3.9 4.3 TWh
+34% 3.2 3.9 4.3 TWh
+ 38%
Construction
1.6 2.0 2.2 TWh
+38% 6 2.0 2.2 TWh
+38%
Service
30.5 2.0 35.2 TWh
+15% 29 3 31.3 36.1 TWh
+23%
Residential
44.0 51.1 55.3 TWh
+26% 46.5 50.2 52.0 TWh
+12%
Industry
77.7 78.1 78.1 TWh
+1% 80.7 78.9 78.7 TWh
-2%
Sum stationary
157.0 167.1 175.1 TWh
+11% 161.3 166.3 173.4 TWh
+8%
Passenger cars 32.3 41.5 49.4 Bv-km
+53% 20.8 13.2 13.9 TWh
-33%
Buses
0.64 0.69 0.79 Bv-km
+24% .4 1.5 1.7 TWh
+19%
Trucks
1 .2 9.1 25.7 Bv-km
+108% 15.8 21.6 29.2 TWh
+85%
Other transport
23.4 29.7 35.3 TWh
+50% 23 4 29.7 35.3 TWh
+ 51%
Total energy
223 232 253 TWh
+14 %
Figure 21 Statistical final energy consumption 1990-2013
and projection of i l e rgy consu ption of analysed
scenarios 2010-2050 (TWh/year)
Figure 22 Sta istical electricity consumption 1976-2013
and projection of elec ri ity consumption of analysed
scenarios 2010-2050 (TWh/year)
Figure 23 Powe productio a d net elec ricity trade
2010-2050 in th reference path (TWh/year)
Figure 24 Net power trade with neighbouring countries
in the different scenarios in 2020-2050 (TWh/year)
ble 9
Energy service dema d and final en rgy consumption in the reference pa
Figure 21
Statistical final energy consumption 1990-20 3 and
projection of final energy consumption f analysed scen rio 2010-2050
(TWh/year)
Figure 22
Statistical electricity consumption 1976-2013 and projection
of electricity consumption of analysed scenarios 2010-2050 (TWh/year)
Figure 23
Power production and net electricity trade 2010-2050 in the
reference path (TWh/year)
Figure 24
Net power trade with neighbouring countries in the different
scenarios in 2020-2050 (TWh/year)