


 37 / 48

31
also observe that a larger proportion of OWP firms experience that their markets are dominated by
established firms than for PV. This is surprising given that PV could be seen as a more mature industry
than offshore wind.
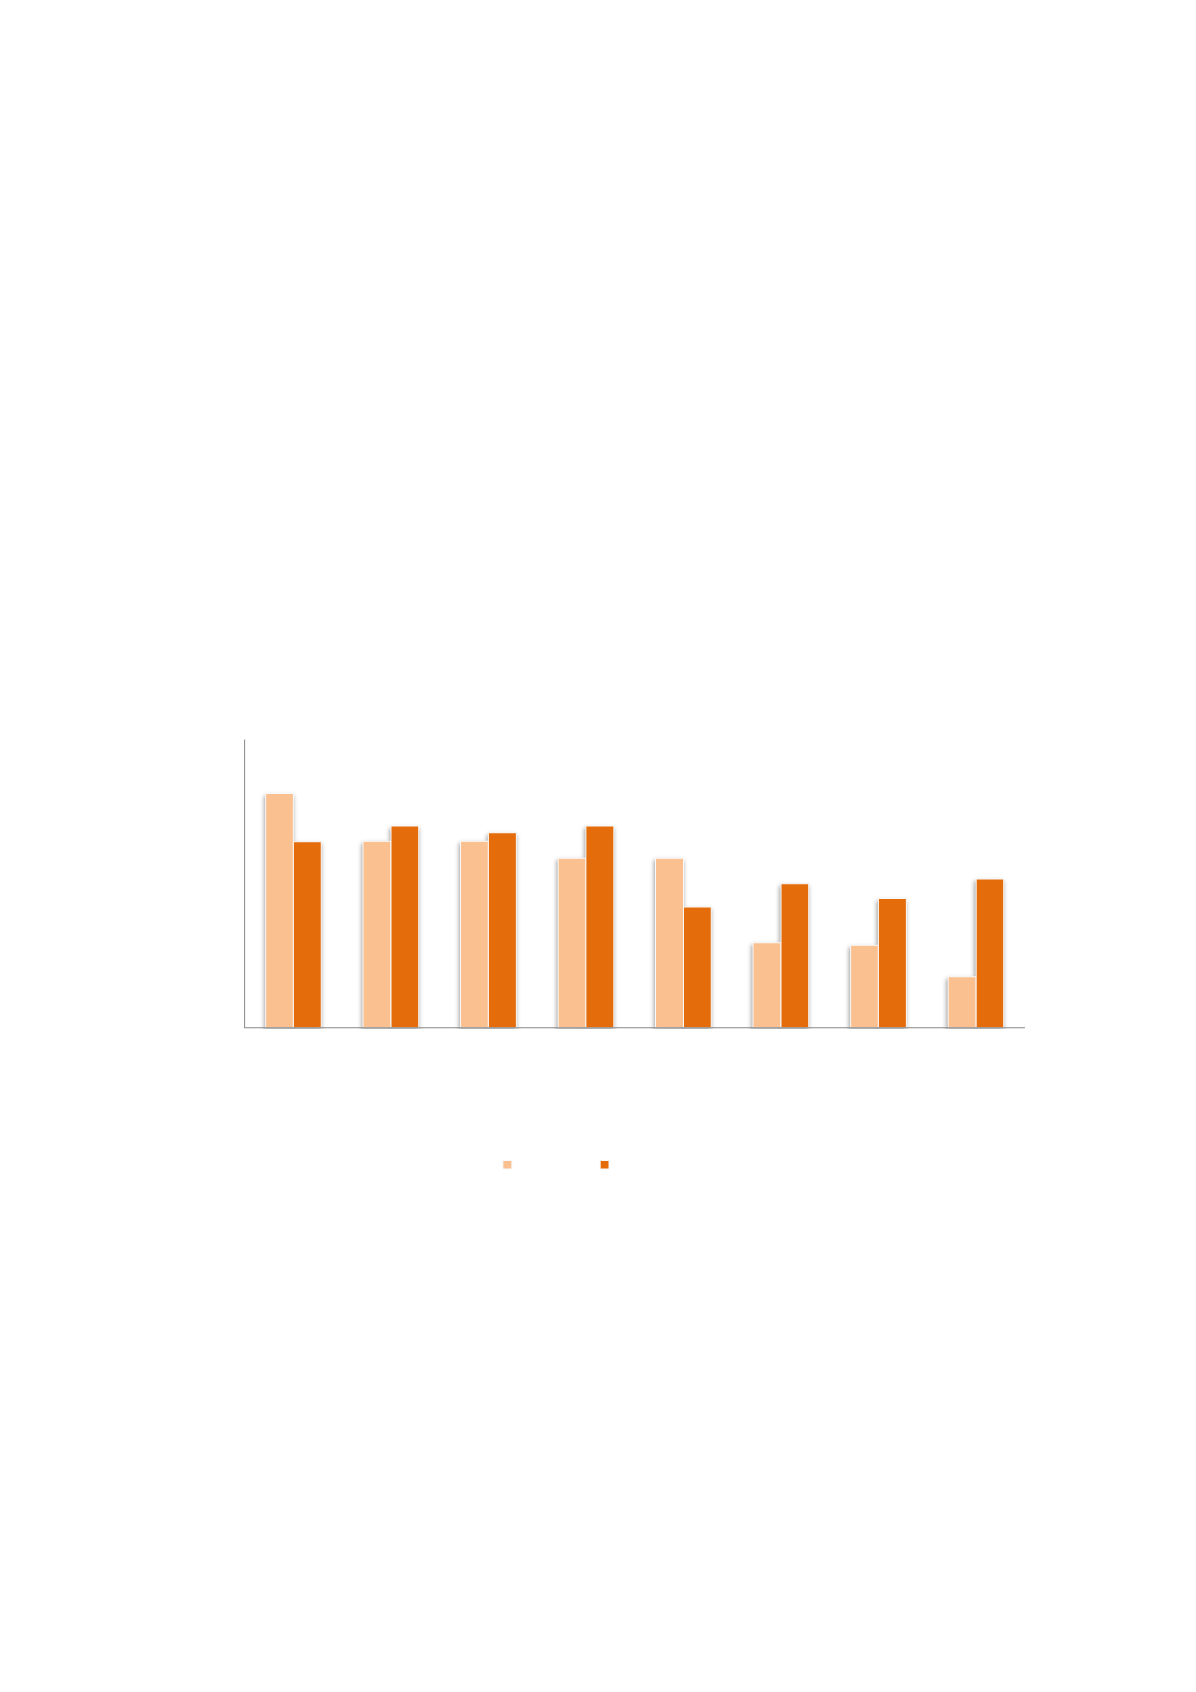
Figure 5-28shows the same barriers for the PV industry, split between PV system firms and all other
firms (delivering components and services to the PV supply chain). Here, we can see that the second
group (which consists mostly of firms producing silicon and other raw materials as well as firms
delivering consultancy and R&D services) to a greater extent than the system firms respond that the
market is dominated by established firms
. They also find it comparatively more
demanding to test and
qualify products or service
. Some of the firms producing raw materials have introduced novel products
and processes on the global market (Hanson 2013), which could explain a greater need to test and
demonstrate these products. However, as these firms are mostly oriented towards international
markets, this difference could also be explained with the importance of a home market for testing and
demonstration.
Figure 5-28 Perceived barriers for PV firms. Split between system firms and all other firms.
Respondents answered
yes
or
no
on whether each potential barrier was challenging for their activity in PV.
Moving over to offshore wind, we can only find minor variations across the supply chain. However,
figure 5-29shows that OWP firms with maritime as the core industry perceive
costs of product and
service development
as less of as a barrier compared to firms in other segments along the supply chain.
We interpret this as indicating that maritime activities in OWP are fairly similar to maritime operations
in other industries, and that costs of entry from maritime industries to OWP might be lower than for
firms with core activities in other industries.
0%
20%
40%
60%
80%
100%
Uncertain
demand
Access to
capital
Demanding to
find customers
Cost of
product and
service
development
Access to
qualified
labour
Demanding to
test and
qualify
product or
service
Geographic
distance a
challenge
Marked
dominated by
established
firms
Percentage of firms
PV system All other PV