


 40 / 48

34
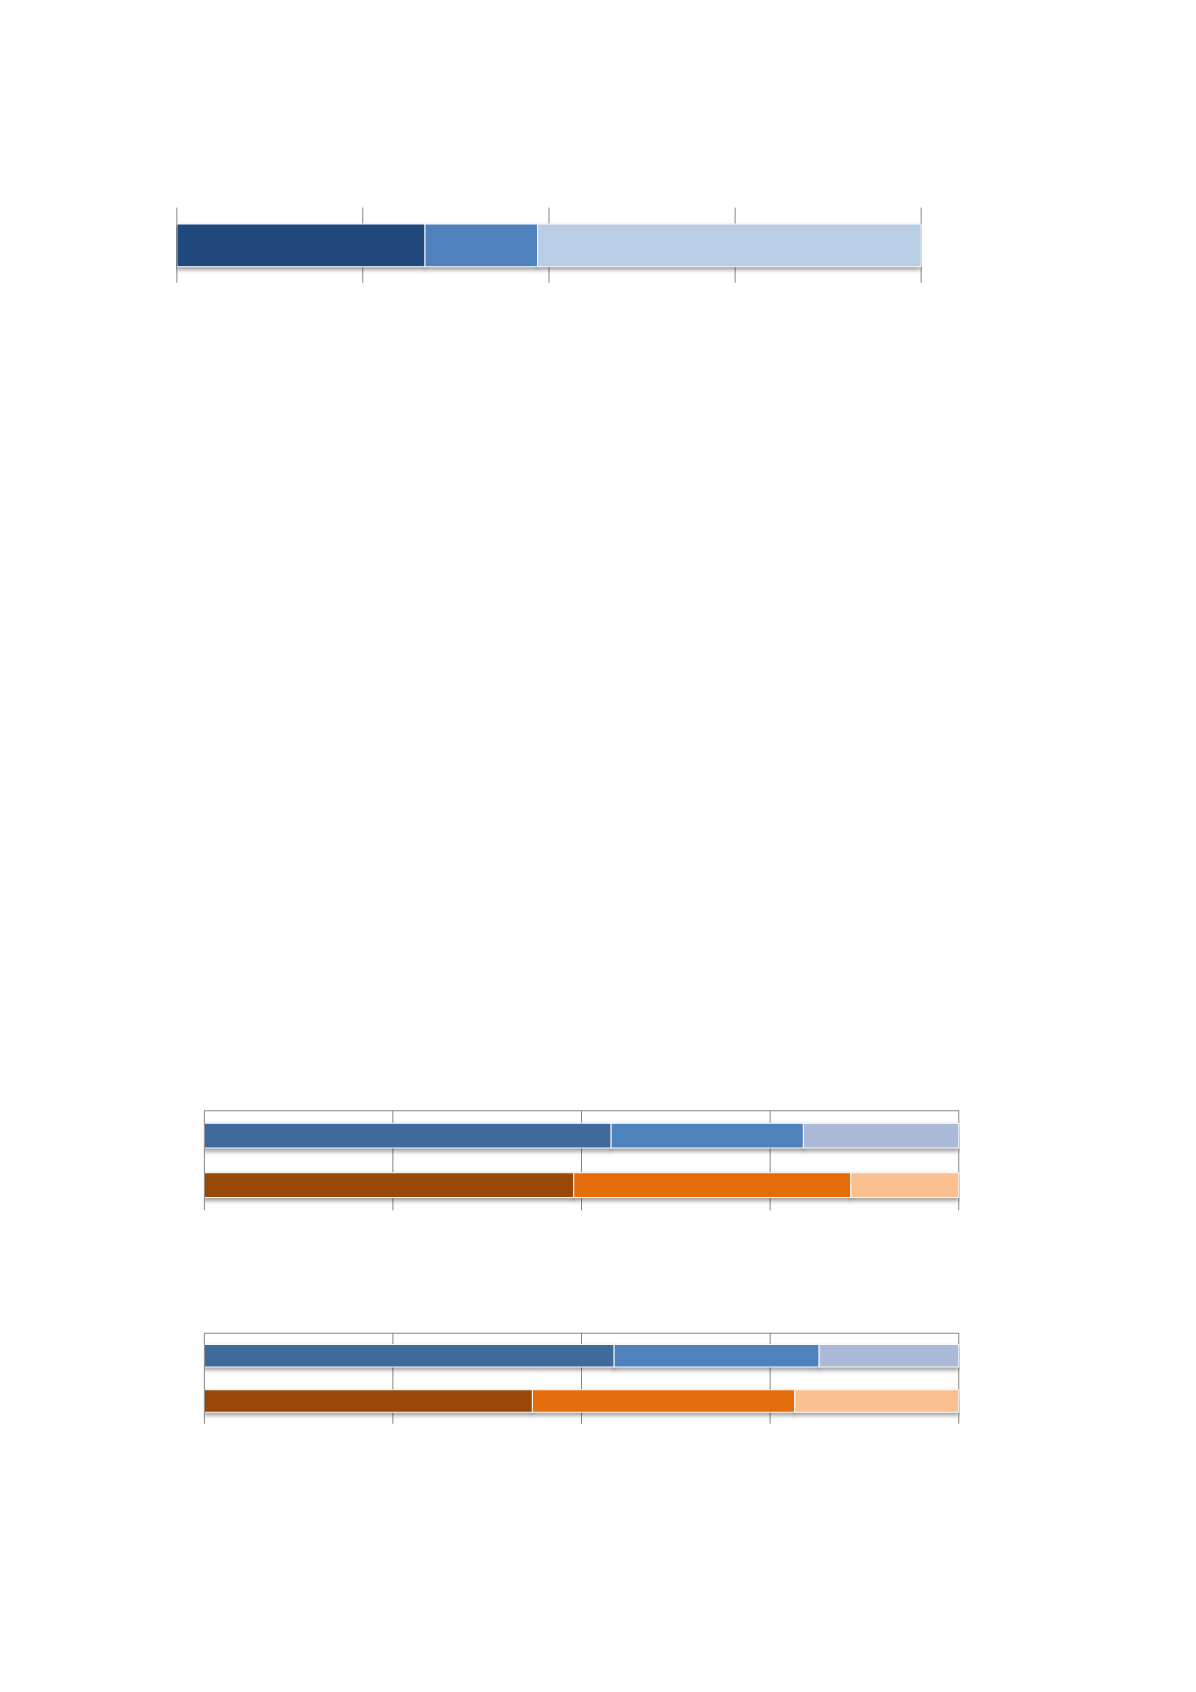
Figure 5-32 Percentage of firms that fully or partly consider the North Sea as a domestic market for offshore wind
In conclusion, we make two main observations based on the data presented in this section on the role
of home markets for offshore wind. First, a large number of firms do experience the lack of a domestic
market as a barrier to internationalisation. Second, the finding that larger firms depend less on the
presence of a domestic market (se
e figure 5-31)is perhaps not surprising. Large firms have more often
established international activities and are better equipped to handle risk. However, the Norwegian
industry structure consists of mostly small and medium-sized enterprises. The potential for these firms
to succeed in the international market for offshore wind may depend particularly on national policies
that target barriers to internationalisation encountered specifically by smaller firms.
5.6
Expectations for future development
The level of activity in both offshore wind and solar PV amongst the surveyed firms has increased over
the last 3 years
. Figure 5-33 shows that about half of the surveyed firms report that the number of full-
time equivalents dedicated to OWP and PV has increased, whereas around 20 per cent of the firms
report that this has declined. Moreover,
figure 5-34shows that the turnover from OWP and PV as a
share of total turnover has also increased for approximately half of the firms.
Figure 5-33 Development of number of full-time equivalents over the last three years
Figure 5-34 Turnover from OWP and PV as percentage of total turnover. Development over last three years.
Fully
Partly
None at all
0 %
25 %
50 %
75 %
100 %
To what extent does the North Sea replace the need for a domestic market?
Increased
Increased
Same
Same
Declined
Declined
0 %
25 %
50 %
75 %
100 %
OWP
PV
Percentage of firms
Increased
Increased
Same
Same
Declined
Declined
0 %
25 %
50 %
75 %
100 %
OWP
PV