


 33 / 48

27
Figure 5-20 Location of actual or potential customers. Percentage of total FTEs dedicated to OWP or PV within firms in
sample.
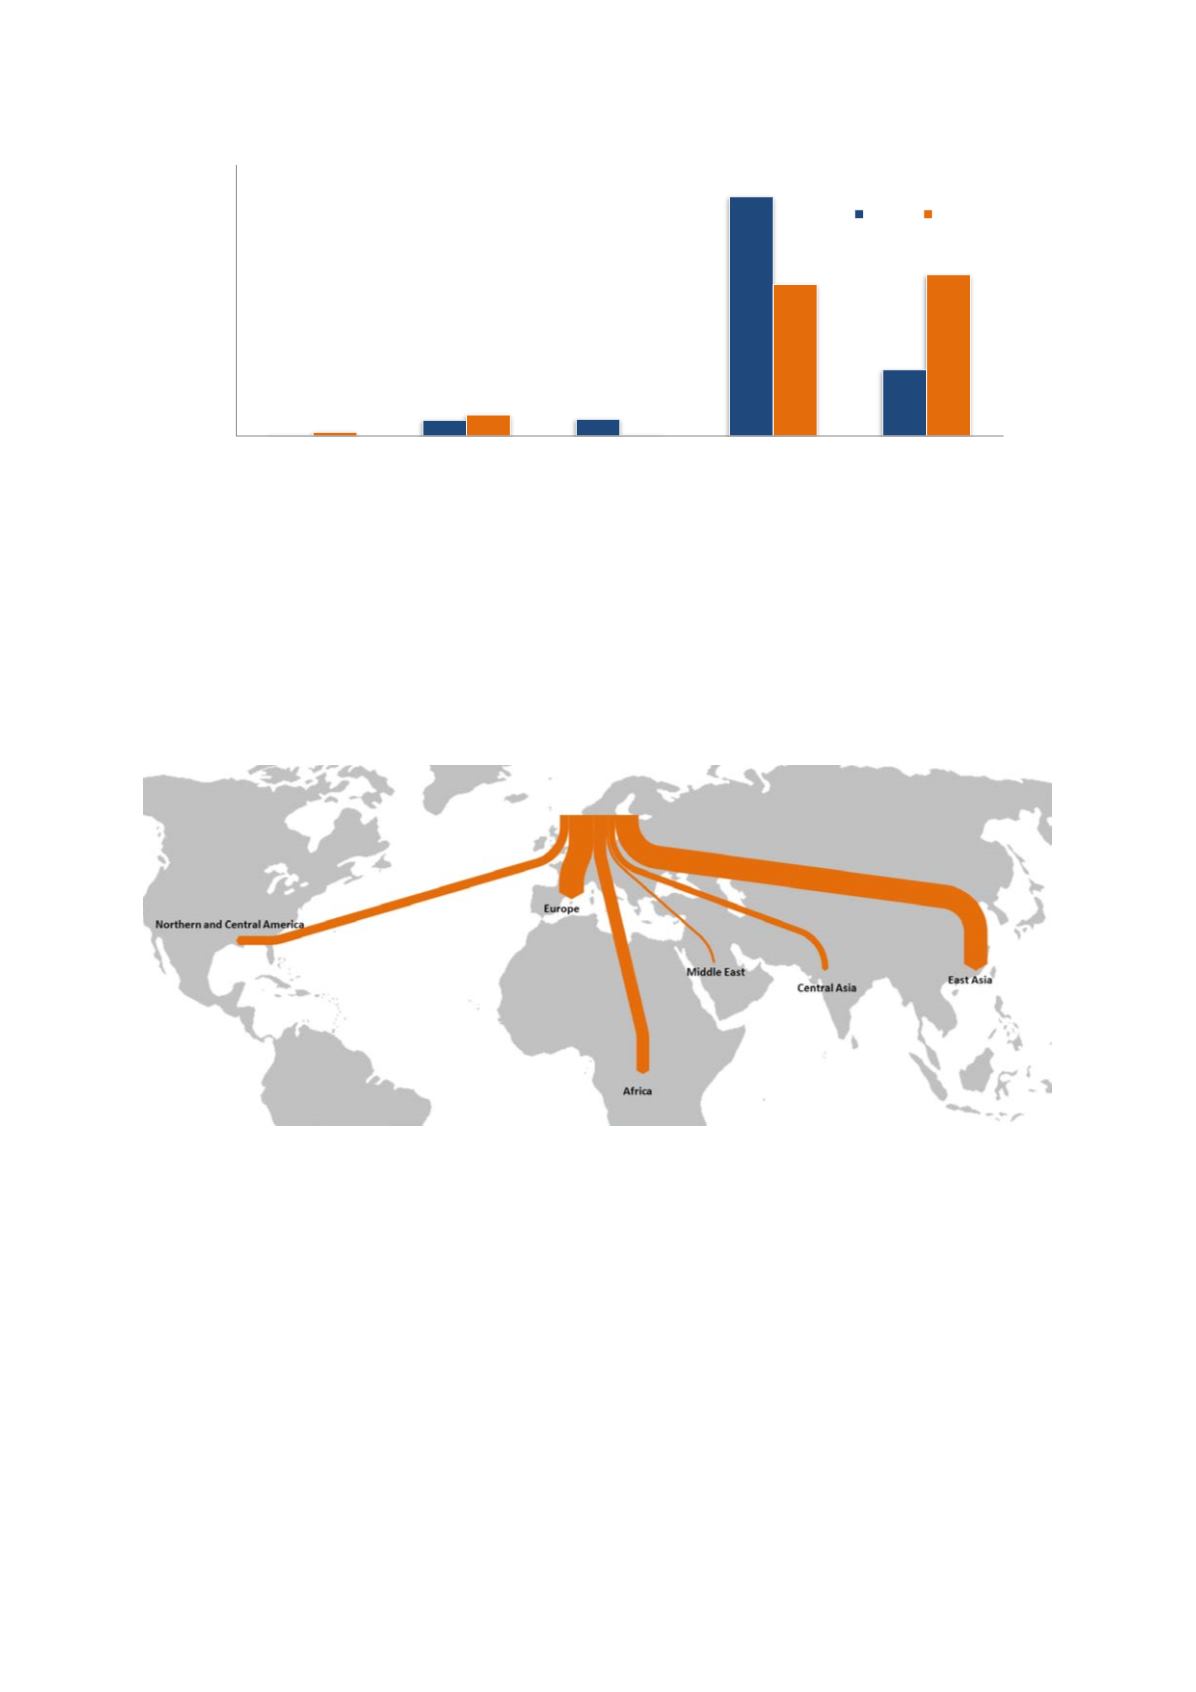
Given that most of the OWP firms and many of the PV firms primarily target international markets, it
is interesting to look at where these markets are
. Figure 5-21and
figure 5-22 show that the PV firms
have customers in most parts of the world, in particular countries like China, Japan, USA and a wide
range of countries in Africa and Europe.
Figure 5-21 Location of the most important existing and potential customers for Norwegian suppliers to the international
PV markets.
The OW firms are highly concentrated around the markets in the North Sea. This is not surprising
considering that the majority of the international offshore wind market has developed in this area, and
given the Norwegian offshore firms’ historical presence in this region.
0%
20%
40%
60%
80%
Exclusively domestic Mostly domestic Equally domestic and
international
Mostly international
Exclusively
international
Percentage of FTEs
OWP PV