


 28 / 48

22
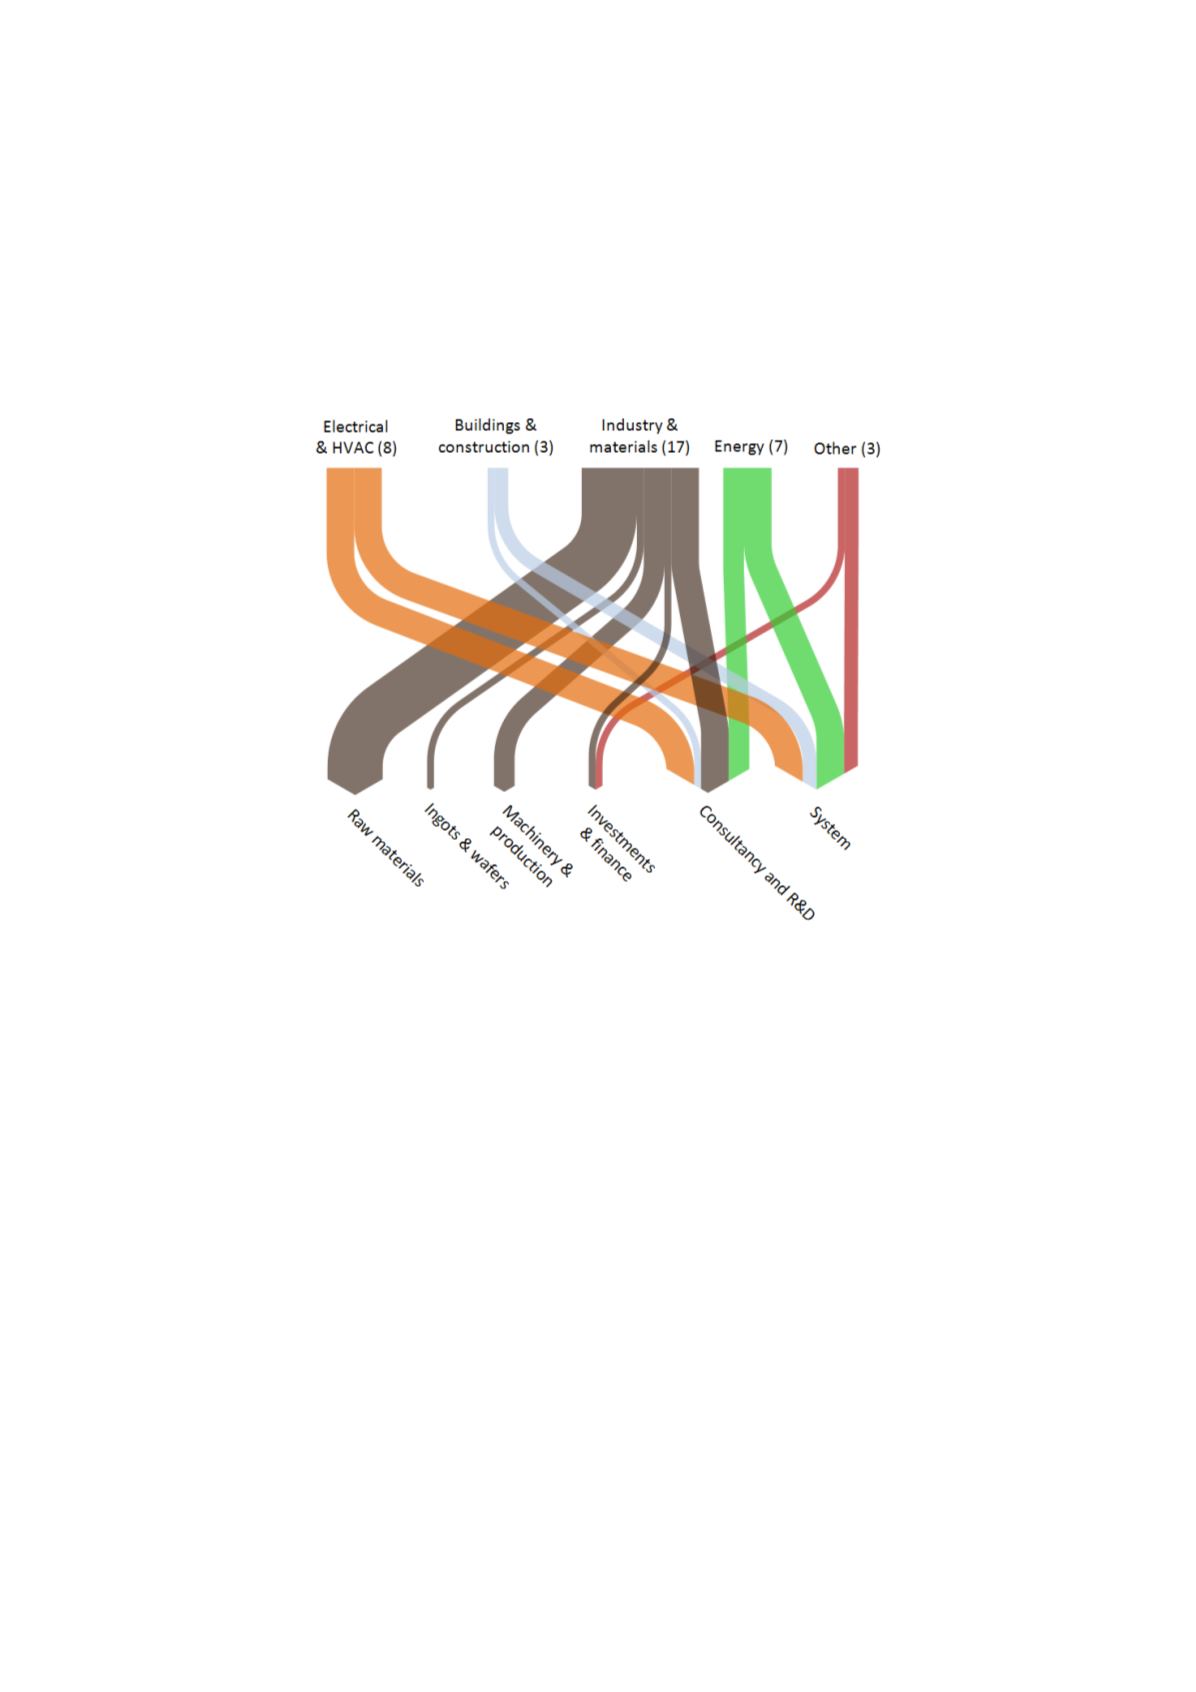
Figure 5-12shows the relation between the experiences firms draw upon for their PV activities. Here
we observe that firms in
raw materials
,
ingots and wafers
as well as
machinery
draw their experiences
from
industry & materials
entirely. It is also worth noting that experiences
from industry & materials
are distributed across most segments along the supply chain, with exception of the
system
segment.
Firms in the system segment draw on experiences from several industries including
electrical and HVAC
as well as
energy
.
Figure 5-12 Relation between experience from other industries and PV supply chain (number of firms)
We also asked respondents whether experiences were transferable from primary to new industry
applications with
minor
,
some
or
significant
changes. The dominant share of firms (72 per cent for
OWP and 77 per cent for PV) state to have made some changes in order to cater to the OWP or PV
markets. This means that even if firms have relevant experiences they do not move into OWP or PV
without making any changes to the products or services. Given that the firms build on rather different
areas of experience, we see it as interesting to explore the degree of variation of transferability
depending on experience fromwhich firms build their activities in OWP and PV upon. Fro
m Figure 5-13,we can see no significant variation for OWP
. Figure 5-14 shows that there is some variation for PV firms
as firms with experience from
electrical & HVAC
as well as
industry and materials
respond that
transferring experiences involves more significant changes than the rest of the sample.