


 6 / 36


Position Paper: CenSES Energy demand projections towards 2050
6
ity production
dro power production increases in the reference path by 33 TWh towards 2050, while wind power
tion increases by 9 TWh in 2020-2030 and is back at the present level in 2050. The investments in wind
are done during the period with electricity certificates. The net electricity trade increases to 19 TWh in
d is calculated to 14 TWh in 2050 in the reference path. The wind power production increases with higher
ity trading prices as in the LOW activity scenario. If the discount rate is increased from the 4% used in
nalyses, the wind power production decrease. The net power trade is strongly dependent on the
ously given trading prices. Even in the HIGH activity scenario with a substantial increase in Norwegian
ial activity, the Norwegian power production is high enough to meet the demand.
ortation
ojection of transportation demand is based on the National transportation plan, done by Institute for
ort Economics. According to the projection freight transport have the highest increase, and the demand
ble from 2010 to 2050. Transport modes using road represented 60 % of the energy use in transport in
hile domestic sea transport represented 22 %. The growth in transport demand of the reference path is
than the population growth, thus an alternative scenario with a transportation demand based on the
tion growth is analysed; in the energy efficiency and the low activity scenario. Due to more efficient
s, the energy use by cars decreases in all scenarios, except “frozen” where only gasoline and diesel cars
se. The introduction of new types of cars is of high importance, since it can be able to half the energy
ption by cars; however it will require a huge effort in technology development. Equally important will be
ce the demand for car transportation and policies addressing this issue has to be strong.
tial sector
lation growth of 38% until 2050 is calculated to give an increased dwelling area of 60%, but the residential
service demand is only calculated to increase by 25% due to increased energy efficiency. The residential
consumption is in the reference path analysed to increase by about 12% and if all profitable energy
cy measures in addition is implemented the energy consumption may remain at the present level until
he dwelling area in 2050 is divided in about 45% area built after 2010, and most of the rest is refurbished
g area built before 2010, with a small share of dwellings that have not been renovated to an improved
standard. Energy use per capita continues to decrease in the reference path.
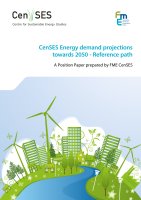
Power production and net electricity trade 2010-2050 in the reference path (TWh/year)
-50
0
50
100
150
200
2010 2020 2030 2040 2050
Power production / trade
(TWh/year)
Wind power
Upgrading
Small hydro
Hydro, run-off-river
Hydro, reservoir
Trade
Figure 1
Power production and
net electricity trade 2010-2050 in
the reference path (TWh/year)
Electricity production
The hydro power production increases in the reference
path by 33 TWh towards 2050, while wind power
production increases by 9 TWh in 2020-2030 and is
back at the present level in 2050. The investments in
wind power are done during the period with electricity
certificates. The net electricity trade increases to 19
TWh in 2030 and is calculated to 14 TWh in 2050 in the
reference path. The wind power production increases
with higher electricity trading prices as in the LOW
activity scenario. If the discount rate is increased
from the 4% used in these analyses, the wind power
production decrease. The net power trade is strongly
dependent on the exogenously given trading prices.
Even in the HIGH activity scenario with a substantial
i crease in Norwegian industrial activity, the Norwegian
power production is high enough to meet the demand.
Transportati n
The projection of transportation demand is base on
the National tr s ortation plan, done by Institute
for Transport Economics. According to the projection
freight transport have the highest increase, and the
demand will double from 2010 to 2050. Transport
modes using road represented 60 % of the energy
use in transport in 2010, while domestic sea transport
represented 22 %. The growth in transport demand of
the reference path is higher than the population growth,
thus an alternative scenario with a transportation
demand based on the population growth is analysed;
in the energy efficiency and the low activity scenario.
Due to more efficient vehicles, the energy use by cars
decreases in all scenarios, except “frozen”where only
gasoline and diesel cars are in use. The introduction of
new types of cars is of high importance, since it can be
able to half the energy consumption by cars; however
it will require a huge effort in technology development.
Equally important will be to reduce the demand for car
transportation and policies addressing this issue has to
be strong.
Residential sector
A population growth of 38% until 2050 is calculated
to give an increased dwelling area of 60%, but the
residential energy service demand is only calculated to
increase by 25% due to increased energy efficiency. The
residential energy consumption is in the reference path
analysed to increase by about 12% and if all profitable
energy efficiency measures in addition is implemented
the energy consumption may remain at the present
level until 2050. The dwelling area in 2050 is divided in
about 45% area built after 2010, and most of the rest
is refurbished dwelling area built before 2010, with a
small sh re f dwellings that have not been renovated
to an improved e ergy standard. Energy use per capita
continues to d crease in th refere ce path.
Service sector
The building area of the service sector is calculated to
be increased by 48% in 2050, compared to an increase
in energy service demand of 18%. About half of the
area in 2050 will be built after 2010 and the rest will be
refurbished, with the assumptions used in the analyses
presented here. The energy consumption per capita
is calculated to decrease by 10% until 2050, at the
same time as the electricity use per capita decrease by
almost 20%. The most important parameter for future
energy consumption in buildings is the population
development.
Industrial activity and uncertainty
To illustrate the uncertainty of particularly the energy