


 86 / 390

temperature is computed from the initial concentration. Then at each solidification step
(except last step), the following algorithm is employed:
1.
Store the starting concentration
2.
LOOP to find the appropriate amount of Si phase (sub-step is set at 1% of the
current cell size)
a.
Compute the liquid concentration assuming a partial solidification of the
cell without any precipitation based on the starting concentration
b.
LOOPs for precipitation
i.
Test if precipitation occurs for each particle based on this "trial"
liquid concentration
ii.
If precipitation occurs, compute the composition and amount of
precipitate that forms (applying the mass balance) until the
solubility limit is reached
iii.
Update the "trial" liquid concentration with the new liquid
concentration for that solubility limit
iv.
Go to the next particle type
c.
Test if the total amount of phases formed (including Si) is close to the
mass of the cell, and if not go back to Step 2 and increase the amount of
solidifying Si
3.
From the previous steps we have now a list of particles that precipitate with their
compositions and the precipitated amount. This amount corresponds almost to
the mass of cell (>90%), therefore only a limited scaling is required.
User interface
Sistruc model is programmed in Free Pascal to allow easy build-up of user interfaces.
The code structure is divided between handling user interaction and a mathematical
core where the equations are solved. A modular approach has been used to enable
further development of the code and introduction of more advanced models.
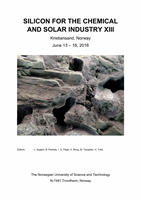
The user interface, as illustrated in Figure 1, is extremely simple when using the default
options. The user needs only to enter the alloy composition and run the calculation. The
program will then generate the history of temperature, liquid concentration, amount of
phases, etc., to be plotted directly in the graphical user interface. Moreover, text files
are generated for visualization and post-processing in a spreadsheet.
*** Initial composition in wt%
Element Alloy1
Al 0.600%
Ca 0.300%
Fe 0.200%
*** Average phases amount in
the grain in wt% ***
Si-solid 98.337%
Al-eutectic 0.087%
Al3FeSi2 0.028%
Al2CaSi2 0.992%
Al6CaFe4Si8 0.556%
Figure 1.
User-interface and microstructure summary output.
Additional options can be enabled through the addition of specific keywords in the input
file. A tool is also available to run simultaneously a set of batch simulations for direct
comparison of ranges of compositions. This interface will be extended to include
78