


 87 / 390

additional parameters such as solidification rate or ingot thickness to compute through
thickness variations.
Model calibration
The current version of Sistruc is mainly calibrated by comparison with phase diagram
data published in the literature. The parameters
Į
i
k
from Equation ( 1
)
and A
i
and B
i
from Equation ( 2
)
are obtained by fitting the following binary phase diagrams: Al-Si,
Ca-Si, Fe-Si, Si-Ti, B-Si and P-Si. Newly reassessed data [7] are used for some phase
diagrams (e.g. Ca-Si and Si-Ti). Based on this first set of parameters, the calibration
procedure is continued by dealing with ternary phase diagram: Al-Fe-Si [8, 9], Al-Ca-
Si [10], Ca-Fe-Si [11], Al-Si-Ti [12] and Fe-Si-Ti [13]. The main focus is put on
liquidus projections and how the model will predict critical points (e.g. eutectoid
Al2CaSi2-CaSi2-Si). In addition when temperature curves are available,
ȕ
ij
parameter
in Equation ( 1
)
is determined. The equation for the formation of Al
6
CaFe
4
Si
8
has been
previously established and is only slightly adjusted to take into account the change in
predicted liquidus temperature.
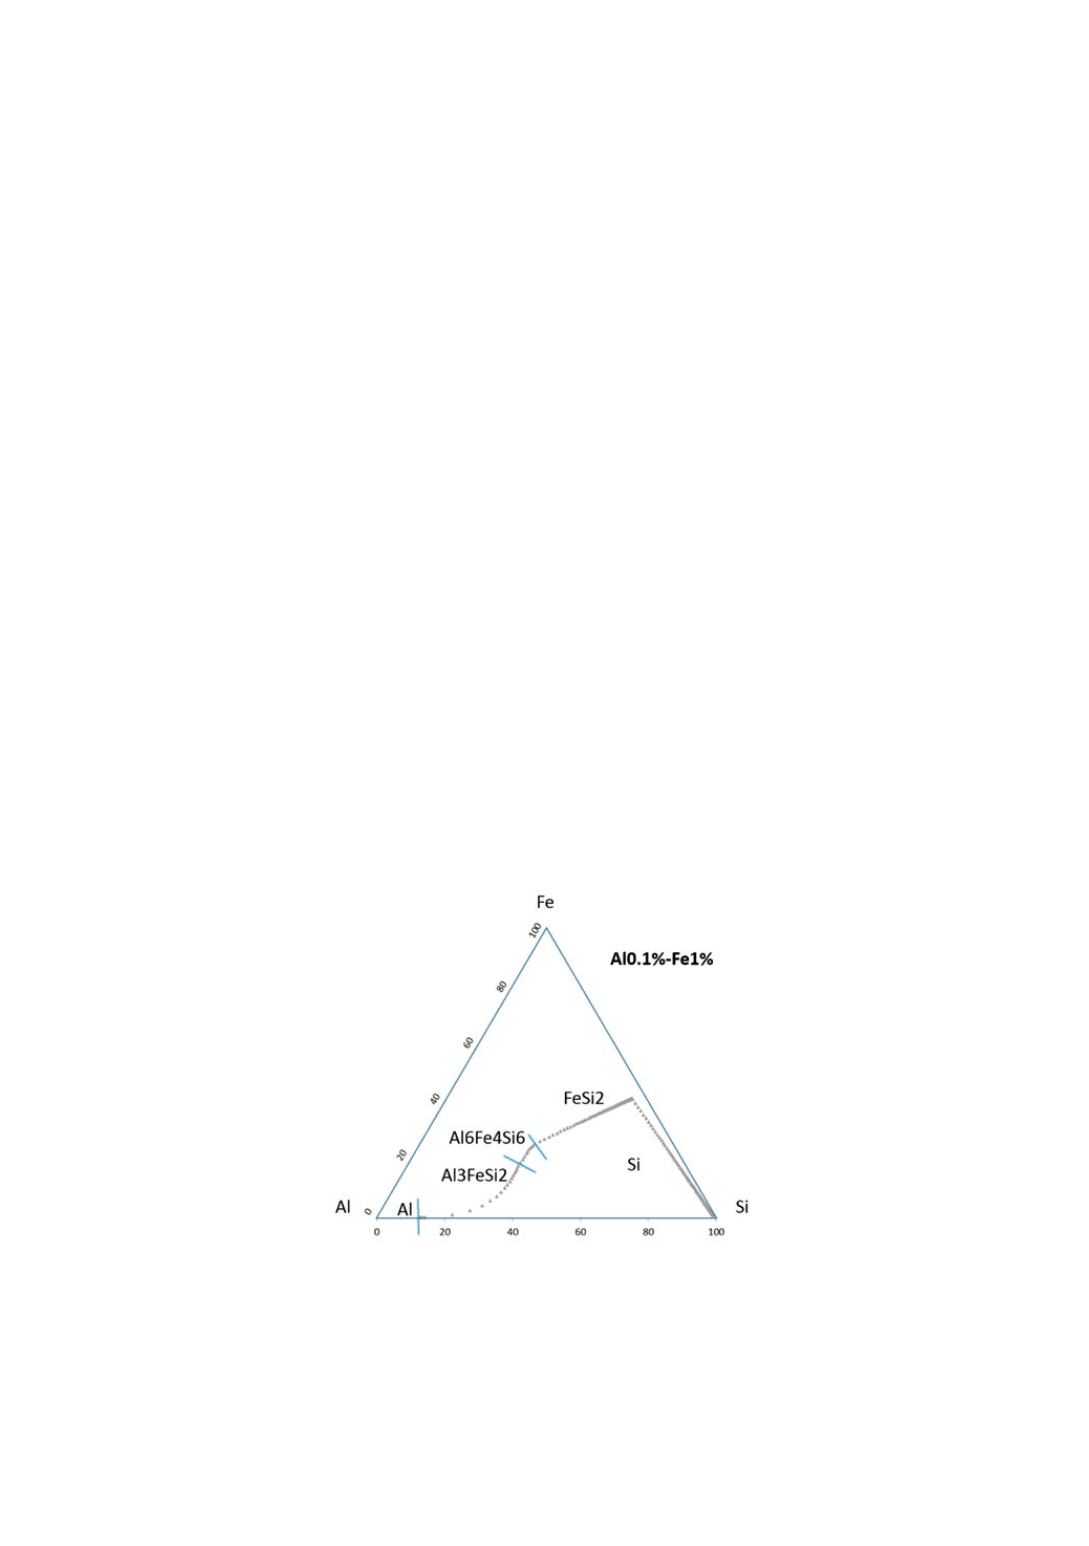
Predicted solidification path for three systems are presented in
Figure 2
to
Figure 4
including the type of phase formed. The results are consistent with published liquidus
projection. For example, eutectoid Al
2
CaSi
2
-CaSi
2
-Si is predicted at 958 °C for a
concentration of 24%Al and 25%Ca while the published data indicates 921 °C for a
concentration of 22%Al and 28%Ca. This discrepancy results from two sources. First
the fitting with the limited set of parameters for Equation ( 1
)
does not allow a very
accurate description. At the critical point, the predicted temperature is 941 °C instead
of 921 °C. Second, Sistruc algorithm induces some numerical approximations (for
example in the successive treatment of the particle instead of simultaneous formation)
that leads to a displacement of the critical point. Nevertheless the error amplitude seems
acceptable for the objective of this microstructure model.
Figure 2.
Computed solidification path for a silicon alloy with 0.1%Al-1%Fe
79