


 175 / 390

To calculate the entrainment flux
E
0
directly at the bed surface (at
h
=0) there are
different semi-empirical correlations available in the literature such as the approach by
Wen and Chen [15] for example, according to Equation 14.
(
)
5.2
5.0 5.3
5.2
9
0
10 07.3
η
ρ
g
uudA
E
g
mf
v
cs
⋅
⋅
− ⋅
⋅
⋅
=
−
(14)
As can be seen from Equation 14,
E
0
depends on the fluid-dynamic parameters bubble
diameter
d
v
and the superficial gas velocity
u
, which are both provided again by the
fluid-dynamic model, taking the bubble behavior in the dense bed into account.
Furthermore, the entrainment flux at the bed surface also depends on the gaseous
property data such as the density
ȡ
g
and the dynamic viscosity
Ș
g
, as well on the
dimensions of the cross-sectional area
A
cs
of the fluidized bed.
The second term in Equation 13 describes the entrainment mechanism that takes over
above the transport disengagement height (TDH). Therefore an elutriation rate constant
k
,i
approach relating to different particle classes, is used [6]. To calculate
k
,i
, there are
several (semi-)empirical equations available in the literature [14] such as the approach
according to Geldart et al [16], shown in Equation 15. From this equation it can be seen
that particle entrainment above TDH, primarily depends on the superficial velocity
u,
on the density of the gaseous phase
ȡ
g
and on the terminal velocity of a single particle
u
t,i
. Hence, at freeboard heights greater than the TDH, primarily particle sizes with
terminal velocities lower than the superficial gas velocity are entrained.
u
u
u
k
g
it
i
ρ
¸¸
¹
·
¨¨
©
§
−
=
∞
,
,
4.5 exp 7.23
(15)
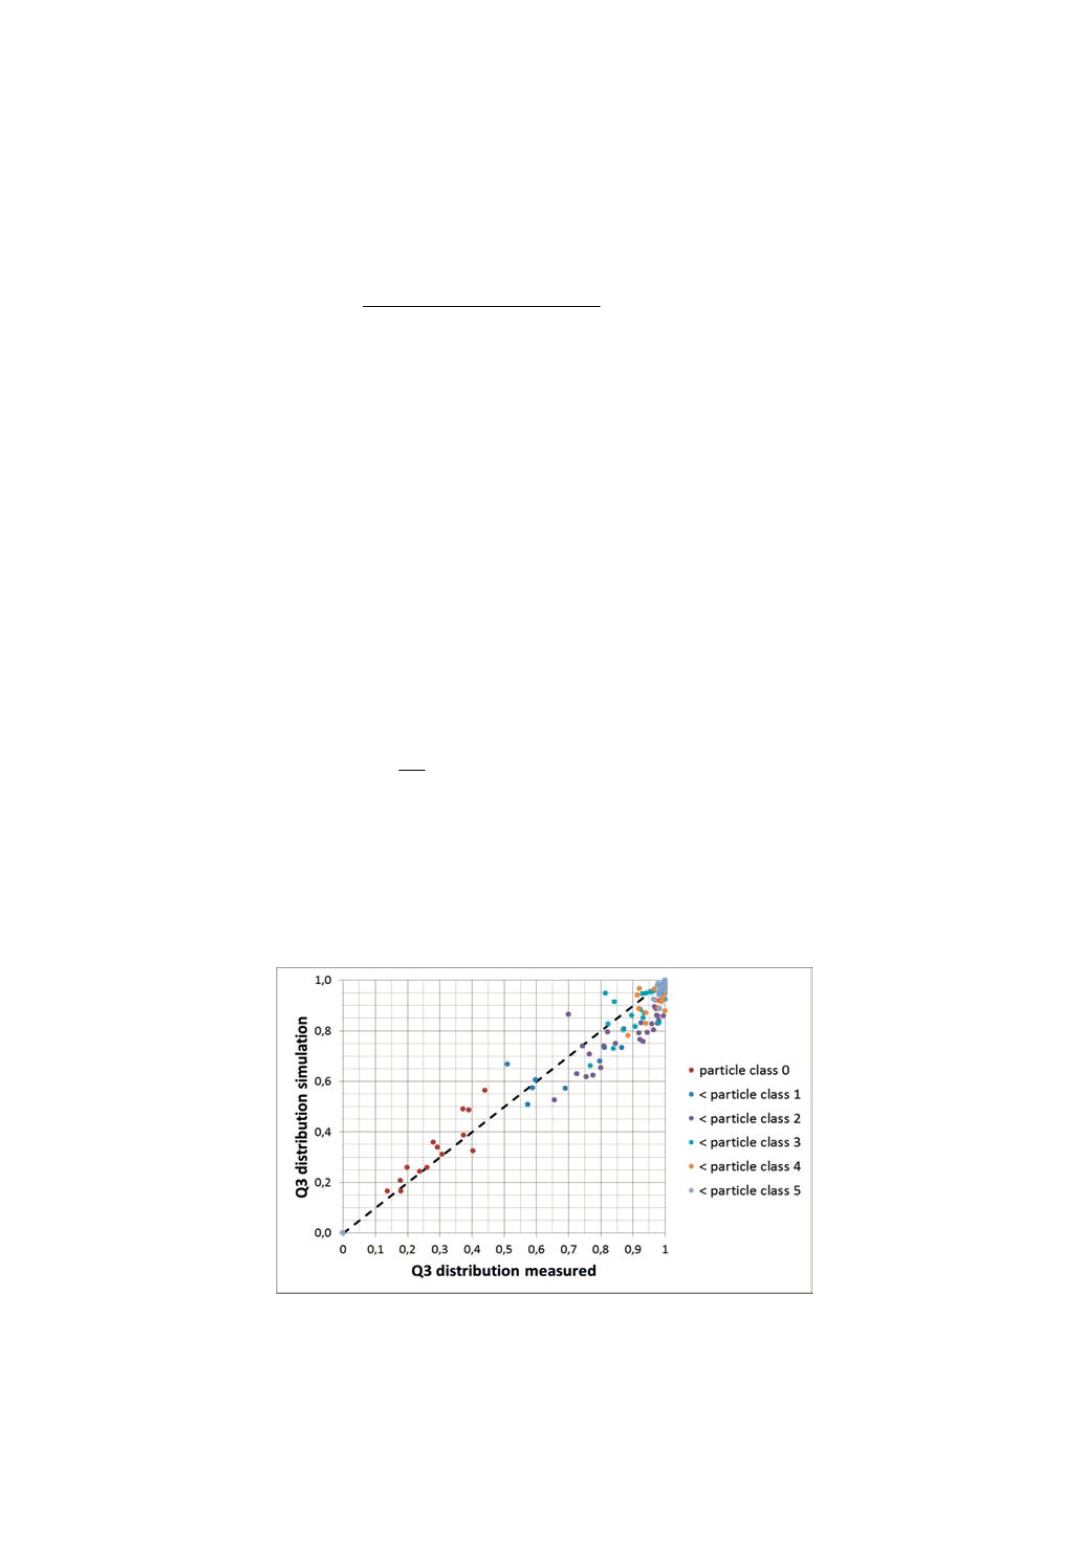
Thus, using Equation 13, the solids mass flow that leaves the reactor with the gas flow
and its particle size distribution can be calculated. Figure 9 shows exemplarily the
results of the model validation for the entrainment of different particle classes by means
of a parity plot that compares the measured and the simulated data. As can be seen, the
simulation results correspond very well to the measured data.
Figure 9
: Model validation results on the entrainment flow rates of different particle classes
167