


 53 / 84

53
SAMC
o
T
• ANNUAL REPORT 2015
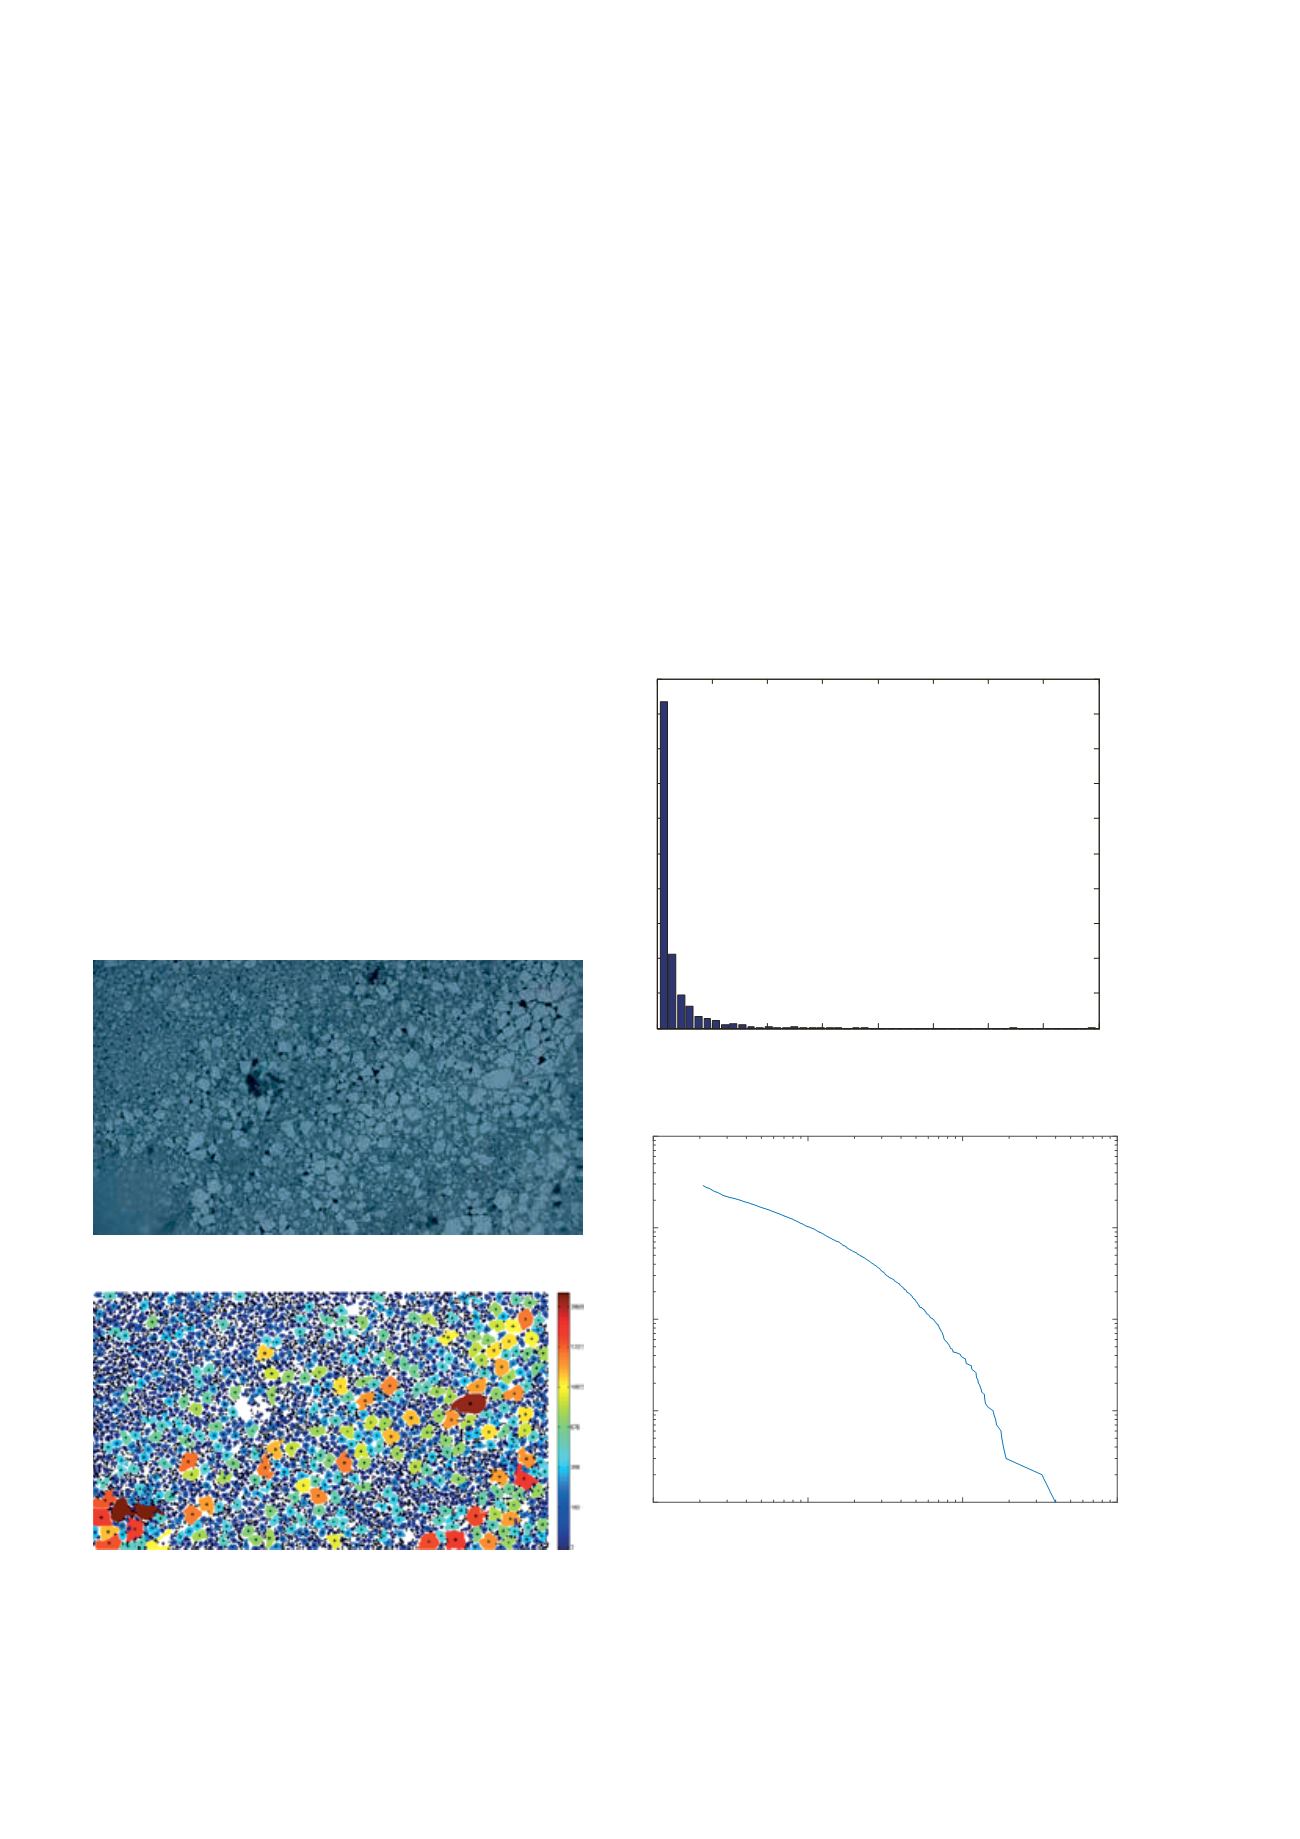
Floe size distribution from sea-ice images
Dr Qin Zhang defended her thesis successfully in the winter
of 2015. In addition to her work as PhD candidate, Zhang
contributed to the OATRC15 research cruise. During this
field activity a helicopter was used to capture ice condi-
tions in the marginal ice zone (MIZ). An example image is
shown in Figure WP5_9. A global sea-ice floe identification
method was performed on the image to identify the ice floe
and brash ice, and the result is shown in Figure WP5_10
(it should be noted that the error identification in the left-
bottom part of the figure was caused by the blur of the
input image, but it can be improved by local processing).
The coverage percentage of different sea-ice types were:
58.00% ice floe; 4.85% brash ice and 21.21% slush.
Based on the identification result, the floe size distribution
(FSD) was estimated as shown in Figure WP5_8. Then, the
cumulative distribution of ice floe sizes as a function of floe
size was calculated (see WP5_Fig. 11), and a power law was
fit to the curves to determine the statistical distribution
of ice floe size (it should be noted that our floe database
produces a complete database of all floes in the image,
where each floe is represented by pixels other than the
geometric parameters. Hence, FSD can be easily updated
by using the “representative diameter” calculated from the
database).
To modify the sea-ice floes and brash ice for the numeri-
cal simulation of the ice-structure interaction, the sea-ice
floes were simplified by assigning a minimum-area-
polygon to each floe, and the brash ice was reshaped by
assigning a same-area-circle to each brash ice piece. As a
result of the simplification the polygonized floes will not be
smaller than the actual identified floes. The individual floe
data, such as its original pixels, the polygon fit, its position,
area, perimeter, image and camera data, etc. are all stored
in a database for further processing.
WP5_Fig. 14: Sea-ice floe and brash ice identification result (global processing).
Based on the identification result, the floe size distribution (FSD) is derived as shown in WP5_Fig. 15.
Then, the cumulative distribution of ice floe sizes as a function of floe size is calculated (see WP5_Fig.
16), and a power law will be fit to the curves to determine the statistical distribution of ice floe size
(it should be noted that, our floe database produce a complete database of all floes in the image,
where each floe is represented by pixels other than the geometric parameters. Hence, FSD can be
easily updated by using the “representative diameter” calculated from the database).
1600
1800
2000
Figure WP5_9 Input helicopter MIZ ice image.
Figure WP5_10 Sea-ice flo a d brash ice identifi ation result
(global processing).
WP5_Fig. 14: Sea-ice floe and brash ice identification result (global processing).
Based on the identification result, the floe size distribution (FSD) is derived
Then, the cumulative distribution of ice floe sizes as a function of floe size i
16), and a power law will be fit to the curves to determine the statistical
(it should be noted that, our floe database produce a complete database
where each floe is represented by pixels other than the geometric param
easily updated by using the “representative diameter” calculated from the
WP5_Fig. 15: Floe size (pixel number) distribution.
0
500 1000 1500 2000 2500 3000 3500 4000
0
200
400
600
800
1000
1200
1400
1600
1800
2000
Figure WP5_11 Floe size (pixel number) distribution.
Figure WP5_12 The cumulative distribution of ice floe sizes
(pixel number) as a function of floe size. Both axes are logarith-
mically scaled.
WP5_Fig. 16: The cumulative distribution of ice floe sizes (pixel number) as a function of floe
logarithmically scaled.
To modify the sea-ice floes and brash ice for the numerical simulation of t
inter ction, the se -ice floes were simplified by assigning the minimum-area-polyg
and the brash ice were reshaped by assigning the same-area-circle to each brash ice
of the simplification of ice floe (brash ice) shapes, the polygonized floes will not be
actual identified floes, and may overlap with other floes and brash ice pieces. The
the model-ice floe modeling, the “overlap flags” of floe-floe and floe-brash wer
polygonized floe besides its position, area, perimeter, and vertices. Moreover, th
10
1
10
2
10
3
10
4
10
0
10
1
10
2
10
3
10
4