


 48 / 84

48
SAMC
o
T
• ANNUAL REPORT 2015
A novel design philosophy for Arctic offshore
floaters protected by ice management
PhD candidate Farzad Faridafshin presents and explores
three major options for the design of marine structures
under uncertainty, as stochastic, robust, and distribution-
ally robust optimization frameworks. The first two method-
ologies relate to probabilistic (or reliability-based) and
non-probabilistic structural design methods respectively,
which are well-established and understood in structural
mechanics applications. The third option, not as much
explored, specifically attempts to immunize the design
against the choice of (generally multivariate) probability
distributions. Using this methodology, instead of requir-
ing an inclusive joint probability density function, a more
limited amount of prior information is extracted from a
dataset. Such prior information can, for example, be the
first- or higher-order moments of a set of data, possi-
bly in addition to some qualitative assumption regarding
the shape and tail behaviour of the underlying probability
distribution. In this methodology, our incomplete knowl-
edge of the distribution is invested in defining a distribu-
tional set, out of which the worst realization is sought, and
forms the basis for design. In other words, the true distri-
bution is unknown to us, but is believed to belong to a set,
out of which we choose the worst one for design purposes.
An appropriate class of distributions for reliability appli-
cations is based on the so-called log-concavity of the
probability density function (just think of it as a mathemati-
cal property). Interestingly, this class covers the majority
of probability distributions that are common in structural
reliability analysis. By only extracting the vector of means
and the covariance matrix from a set of multivariate
data, and by assuming that the underlying (yet unknown)
distribution is log-concave, Faridafshin has shown how a
particular level of reliability can be achieved in a design
process. This works by establishing an uncertainty set
(which happens to be an ellipsoidal set with the dimension
of uncertainty) whose size is related to the target reliabil-
ity. In this framework, even though it is possible to achieve
specified reliability level, the mathematical procedure
builds upon solving a robust optimization problem.
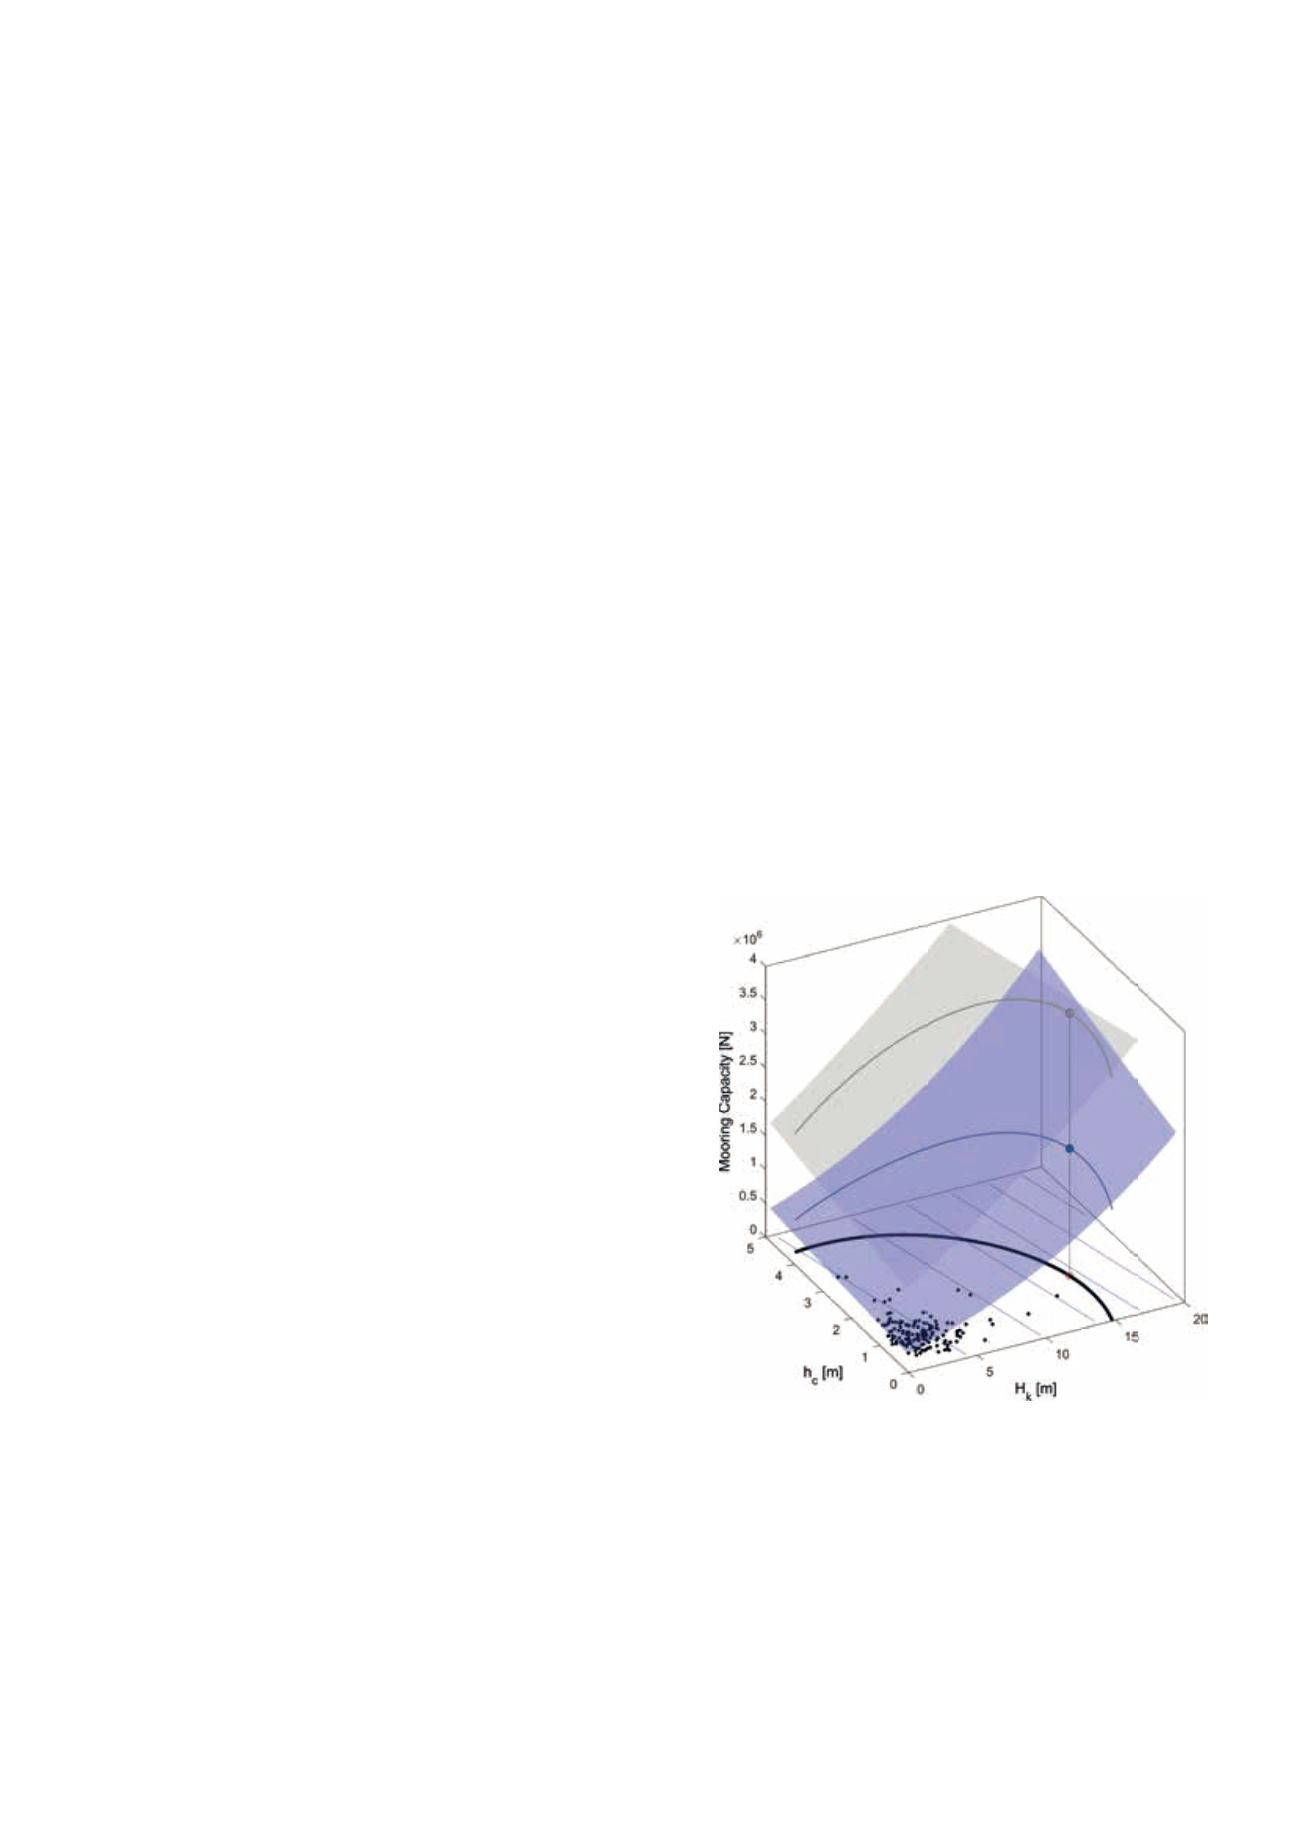
Using an empirical model for the floater response in a
managed ice environment, the above methodology was
applied to evaluate the required capacity for the mooring
lines of a conical floating unit, given an annual exceedance
probability of 10-2 (according to ISO 19906). Eight uncertain
parameters were identified and the 8-dimensional uncer-
tainty set was established. The required capacities were
determined for two different ice management scenarios i.e.
for no ice management and for the case with one traditional
multiyear icebreaker. For illustration purposes, the Figure
below shows the case where only two of the parameters
involved are considered uncertain i.e. the rest of the param-
eters are treated deterministically. These two parameters
are chosen to be the thickness of the consolidated layer
(HC) and the keel draught (HK) of the ridges in the long-
term environment. In the Figure, both the uncertainty set
(bold black curve), as well as its projection on the response
surfaces (in grey and blue) are illustrated where the points
of minimum required capacity (equivalent to maximum
action effect) are marked with bold (grey and blue) dots.
Other classes of distributions such as the unimodal and
Chebychev families are also studied in Faridafshin’s
research. These represent more relaxed prior assumptions
and consequently result in more conservative designs.
Faridafshin is working on a number of publications
discussing the theory and applications of the method and is
expected to finish his PhD during 2016.
Figure WP5_1 Required mooring capacity of an offshore floater
corresponding to annual exceedance probability of 10-2: with
ice management (1.9 MN, blue dot) and without ice manage-
ment (3.9 MN, grey dot). Black dots indicate measured environ-
mental data forming the basis for design. The bold black curve
corresponds to the ellipsoidal uncertainty set based on the first
two moments as well as the assumption of log-concavity. The
red dot is the so-called design point.