


 52 / 84

52
SAMC
o
T
• ANNUAL REPORT 2015
While moving in managed ice, the energy of the vibrations
caused by the ice were hardly measurable. Upon entering
the unbroken ice field, the ice around the vessel failed by
crushing and bending. Due to the bending of the ice, the
ice failed mostly through circumferential cracking. The
transition into unbroken ice is clearly visible in the time-
frequency distribution due to a significant increase in the
energy of the signal over all frequencies. In particular,
vibrations with frequencies between 20 Hz and 30 Hz show
a significant increase in energy. After a few seconds, the
excitation decreases but the energies of the heave-vibra-
tion signals are still significantly higher than in the broken
ice field. The significant excitations upon exiting the ice
channel can be explained by a sudden decrease in veloc-
ity of the vessel. The kinetic energy upon contact with the
unbroken ice might have caused a significant amount of
crushing prior to bending of the ice. As soon as the ship’s
speed decreased, bending failure might have been the
dominant failure mode, which created significantly fewer
vibrations than crushing but still more than the ice interac-
tion with already broken ice inside the ice channel.
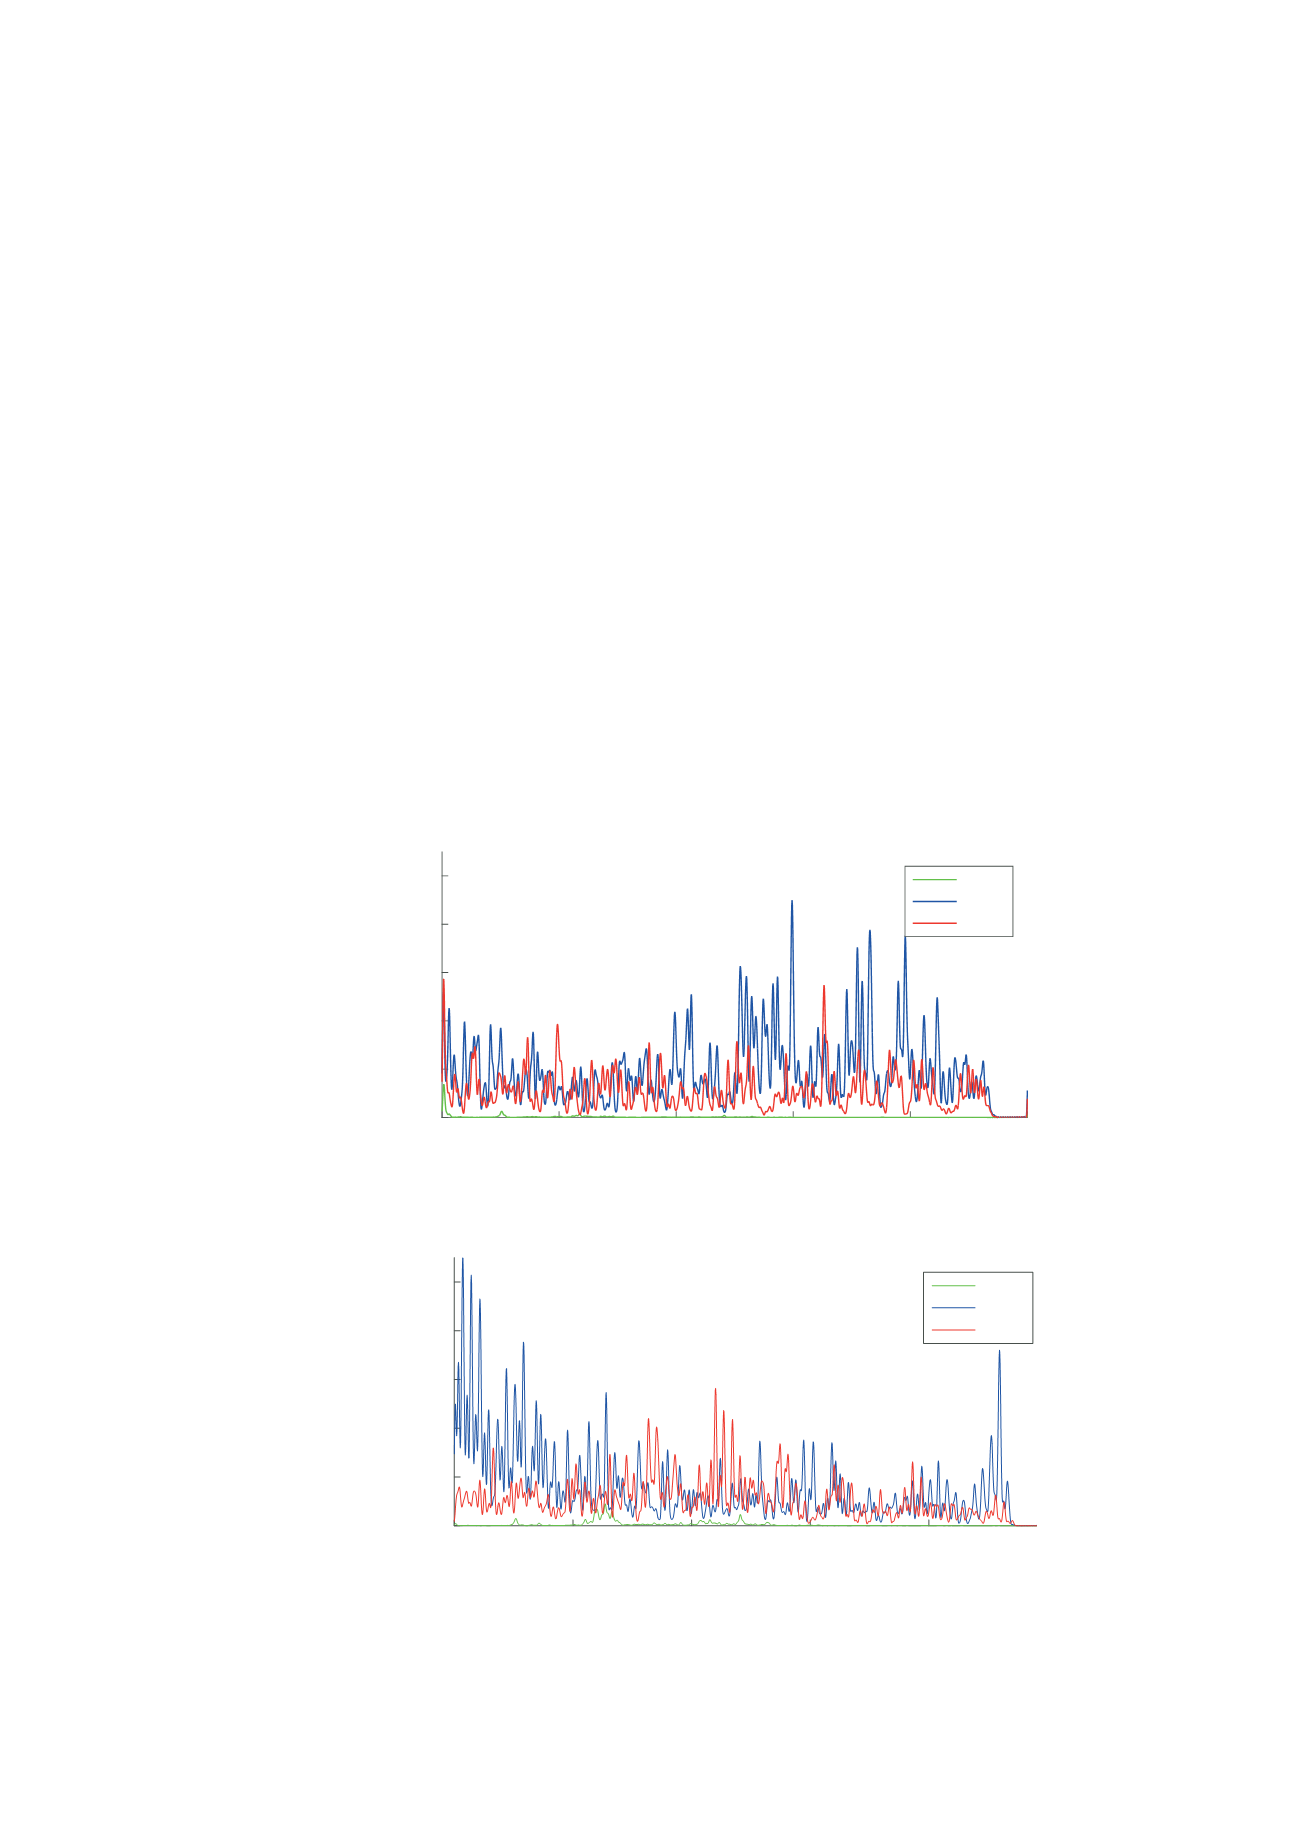
The distribution of the frequencies allows for the identi-
fication of the dominant ice failure mode. Figure WP5_7
and Figure WP5_8 show the power spectral densities
of two situations with different dominant failure modes.
In the case of ice crushing, as shown in Figure WP5_7,
high frequency components become dominant. Crushing
against the hull can cause high frequency, random vibra-
tions, which can explain the significant increase in power at
the higher frequencies between 25 Hz and 40 Hz. When the
ice fails by bending, a repeating force pattern is measured,
which is the reason for the excitation in the low frequen-
cies, as shown in Figure WP5_8.
The technique presented allows for a significant improve-
ment in ice observing systems on ice-going vessels or on
structures in ice. Further research is ongoing to identify
the direction of the ice force, so that the system can be used
as feedback in ice-capable control and monitoring systems
for Arctic offshore operations.
WP5_Fig. 9: Time-Frequency distribution of the transition from broken ice to unbroken level-ice
WP5_Fig. 10: Ice condition while moving from broken to unbroken level-ice
The distribution of the frequencies allows for the identification of the dominating ice failure
WP5_Fig. 11 and WP5_Fig. 12 show the power spectral densities of two situations with di
dominating f ilure mode. I case of ice crushing, as shown in WP5_Fig. 11, high fre
components become dominant. Crushing against the hull can cause high frequency, r
vibrations, which can explain the significant increase in power for the higher frequencies betw
Hz and 40 Hz. When the c fails by bending, a repeating force pattern is measured, which
reason for the excitation in the low frequency, as shown in WP5_Fig. 12.
WP5_Fig. 11: Power spectral density of 20 seconds of measurements while crushing against the hull occured
Frequency [Hz]
0
10
20
30
40
50
Power Spectral Density
0
2000
4000
6000
8000
10000
IMU 1
IMU 3
IMU 4
WP5_Fig. 12: Power spectral density of 20 seconds of measurements while failure by bending of the ice occurred
The presented technique allows for a significant improvement of ice observing systems on ice
vessels or on structures in ice. Further research is conducted to identify the direction of the ice
such that the system can be used as feedback in ice-capable control and monitoring syste
rctic offshore operations.
Frequency [Hz]
0
10
20
30
40
50
Power Spectral Density
0
2000
4000
6000
8000
10000
IMU 1
IMU 3
IMU 4
Figure WP5_7 Power spectral density of 20 seconds of measurements while crushing against the hull occured
Figure WP5_8 Power spectral density of 20 seconds of measurements while failure by bending of the ice occurred