


 51 / 84

51
SAMC
o
T
• ANNUAL REPORT 2015
Spectral analysis of ice-induced accelerations
PhD candidate Hans-Martin Heyn has developed a system
consisting of low-cost inertial measurement units (IMUs)
coupled with a method for analysing the frequency compo-
nents of ice-load signals. The overall aim is to provide an
additional tool for the ice observing part of an ice manage-
ment system for the detection of the severity of ice loads on
a ship or structure.
An array of three to four IMUs are installed throughout
the ship, preferably close to the ice-interaction zone. IMUs
measure the translational accelerations and the rotation
rates at their mounting position. The recorded data are
pre-processed in order to remove noise and to align the
readings of all sensors.
Heyn applies a time-frequency distribution, based on the
Wigner-Ville distribution, on the ice-induced accelera-
tion measurements. The results are time-varying power
spectral densities, which allow for a significantly improved
frequency analysis of the ice-load signals.
The system has been tested during OATRC`15 in September
2015. The ice-load measurement system was installed on
the Swedish icebreakers Oden and Frej. On board each
icebreaker four separate IMUs were installed at various
positions in the vessel. A central server collected the data
from the individual IMUs on each ship, and served as a time
synchronisation server for the sensor units. Furthermore,
synchronised data from other ship systems such as the
GPS system, the gyro-compass and wind sensors were
collected. Images from a 360° camera system and individ-
ual 180° cameras were used on each ship to identify the ice
conditions around the vessel.
During the expedition between the 20th September 2015
and 30th September 2015, a total of 72 hours of ship
motion measurements were taken. The first analyses of
ice-induced accelerations have been conducted for the data
collected on the icebreaker Frej.
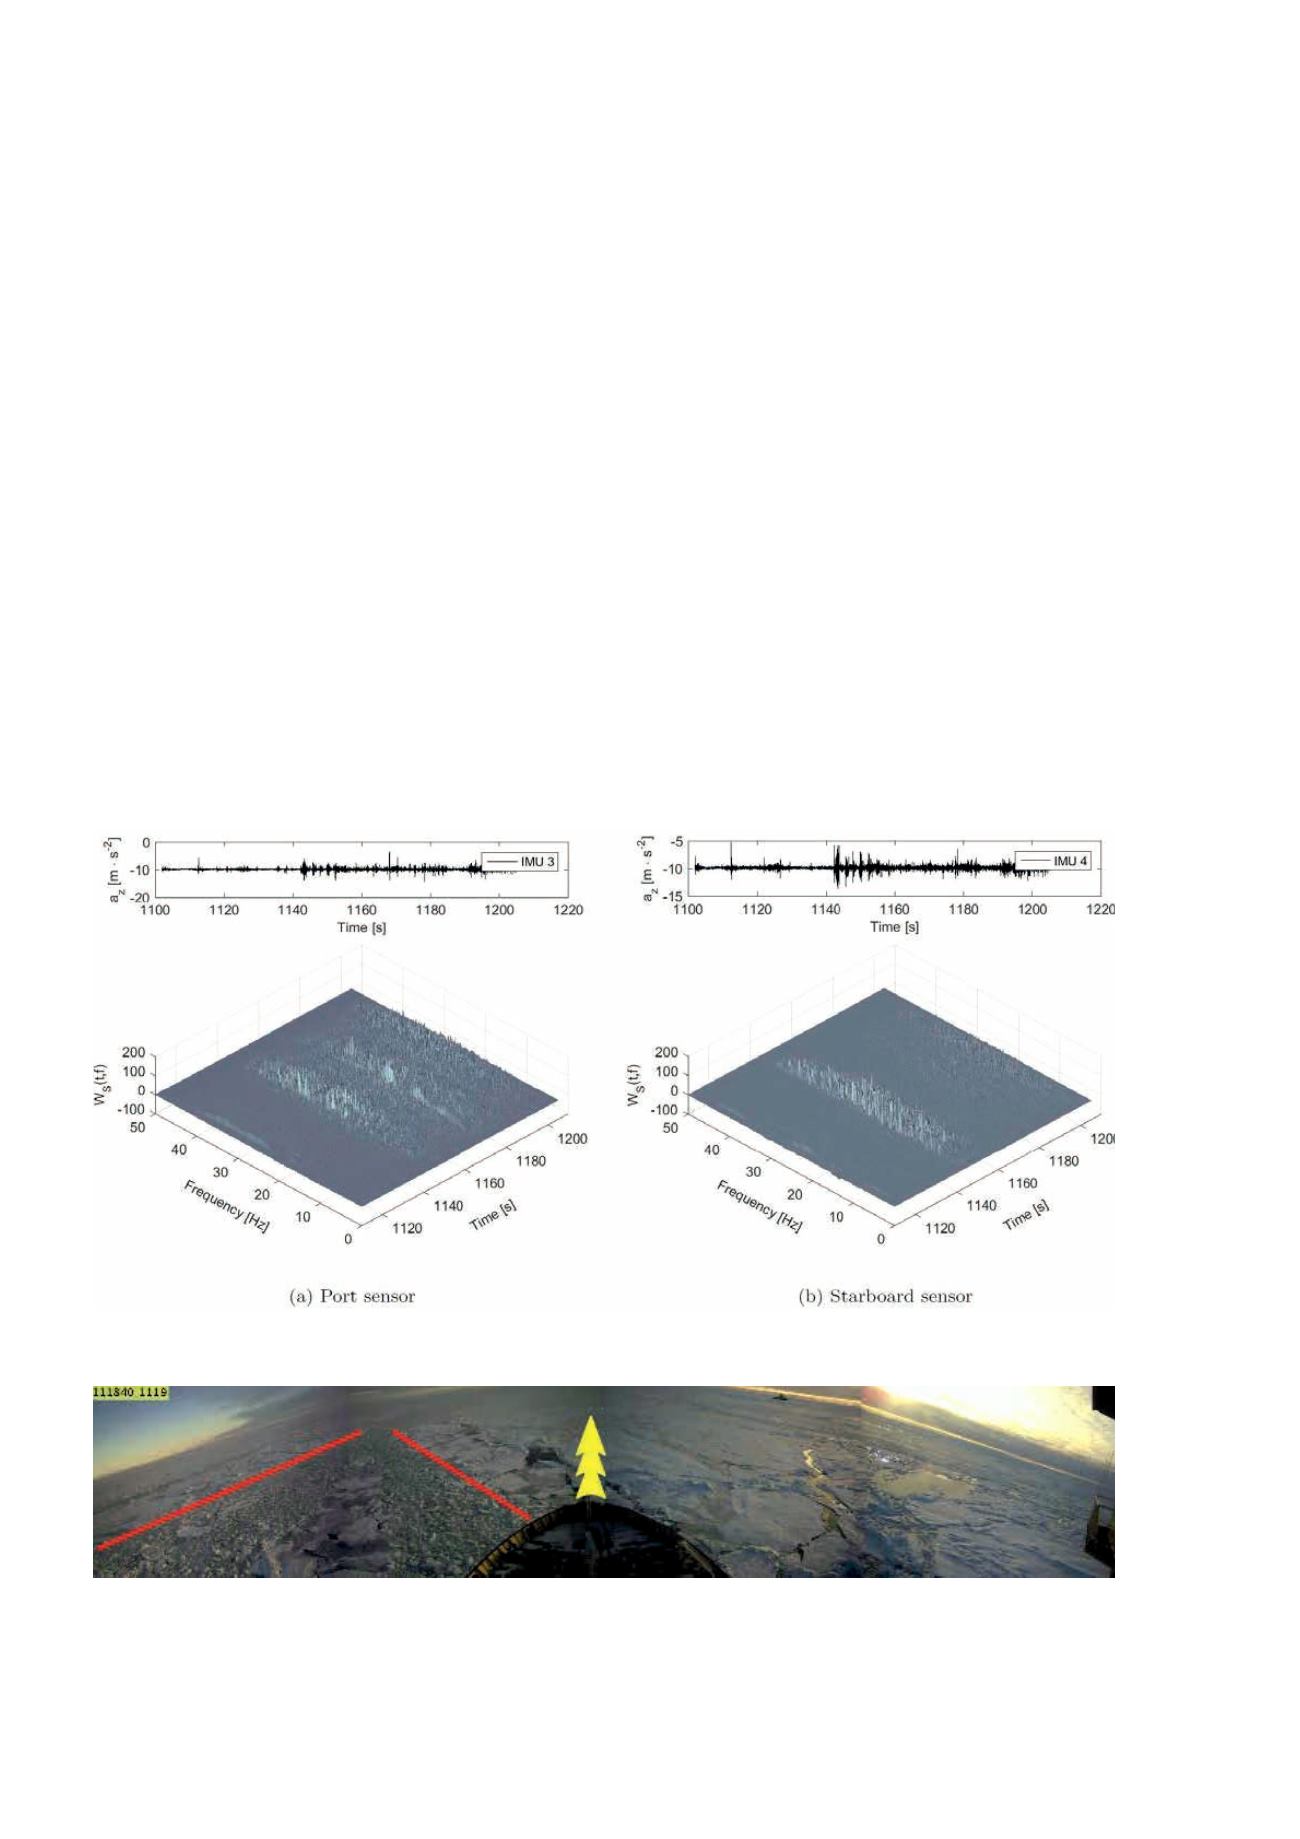
Figure WP5_5 shows the time-frequency distribution of
the heave-motion acceleration measured by the sensor
installed on the port and starboard facing hull.
WP5_Fig. 9: Time-Frequency distribution of the transition from broken ice to unbroken level-ice
WP5_Fig. 10: Ice condition while moving from broken to unbroken level-ice
The distribution of the frequencies allows for the identification of the dominating ice failure mode.
WP5_Fig. 11 and WP5_Fig. 12 show the power spectral densities of two situations with different
dominating failure mode. In case of ice crushing, as shown in WP5_Fig. 11, high frequency
components become dominant. Crushing against the hull can cause high frequency, random
vibrations, which can explain the significant increase in power for the higher frequencies between 25
Figure WP5_6 Ice condition while moving from broken to unbroken level-ice
Figure WP5_5 Time-Frequency distribution of the transition from broken ice to unbroken level-ice