


 205 / 390

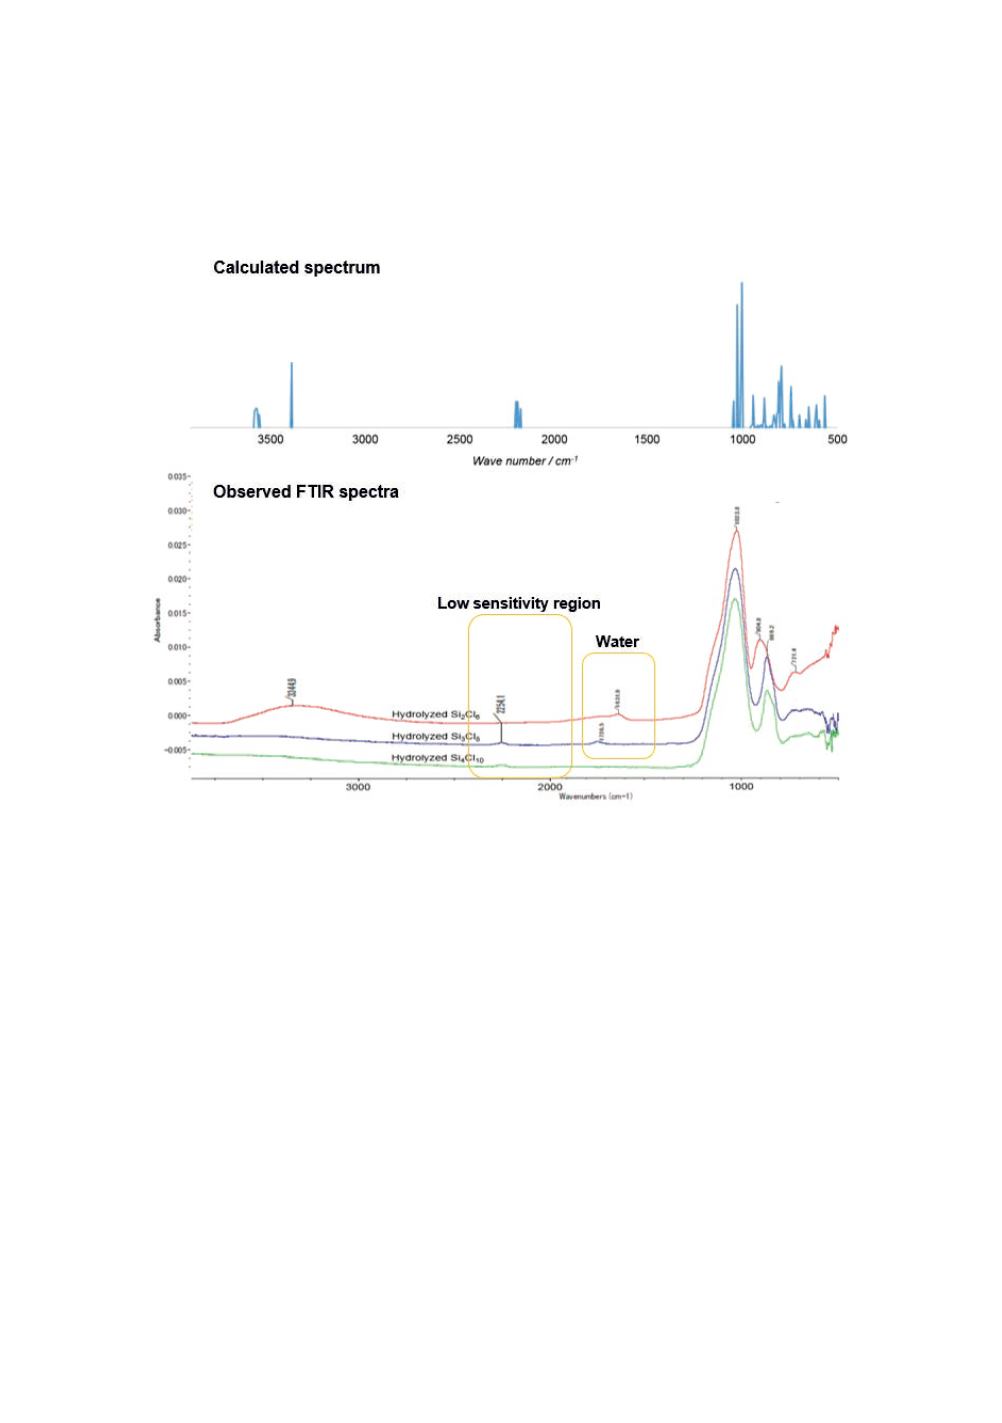
The seven scaled spectra for Models of A through G were compared with the observed
spectra, and Modal A was selected based on the agreement between the calculated and
observed spectra for the further study. The visual comparison is shown in Figure 11
for the selected Model A. A small but independent peak is seen at 892 cm
-1
in the
calculated spectrum. It may be related to the observed 875 cm
-1
peak.
Figure 11
: Calculated absorption spectrum for Model A and FTIR spectra for hydrolysed Si
2
Cl
6
,
Si
3
Cl
8
and Si
4
Cl
10
.
Reaction mechanism for the internal oxidation
The reaction mechanism for the internal oxidation with H
2
formation is explored by
using Model A. The liberation of H
2
accompanying the explosive reaction was actually
observed. The internal oxidation with H
2
formation has been suggested by Britton [1]
and Timms [2].
The internal oxidation can be divided into two categories, that is, intramolecular and
intermolecular reactions. The former possibility was explored in this study.
One reaction path for the intramolecular oxidation was thus found. The schematic
potential energy surface along the path is shown in Figure 12. The path is composed
of three transition states (saddle point structures) and two metastable states (equilibrium
structures) in between as well as the reactant (Model A) and the products. The energy
barrier of each step is evaluated from the difference of the total electronic energy plus
nuclear repulsive energies between the transition state and the stable/metastable state.
The zero-point energy associated with the vibrational motion was corrected for those
energy values. The corrected energies for the five states relative to Model A are shown
in square brackets.
197