


 140 / 390

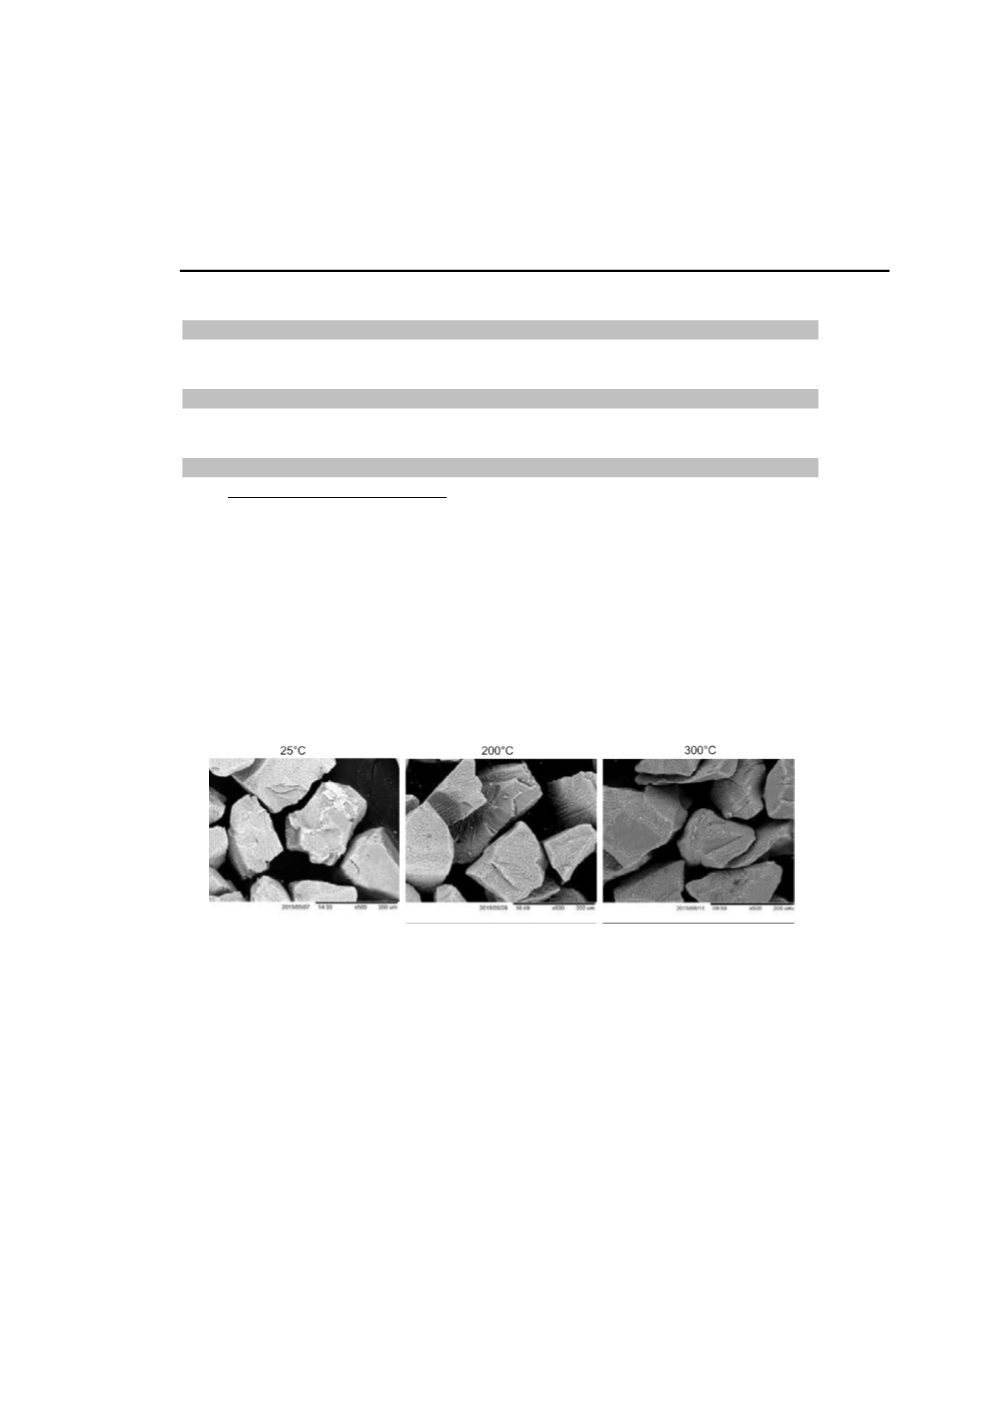
Table 1
:
Mixing silicon and contact mass under nitrogen at fixed temperature before MCS
reaction : analysis of fractions from day 1 and from day 2
Catalyst content
Catalyst transfer
Exp Temp Si Fraction
Weight
Si utiliz.
Cu Sn Zn Cu Sn
Zn
(°C)
(day)
(g)
(wt%)
(wt%)(ppm)(ppm) (%) (%) (%)
1
25°C
-100µm (d1)
106g
49%
3,3 170 1410
1 25°C
+100µm (d2)
32g
36%
0,8 70
490 3% 6% 2%
2 200°C -100µm (d1)
107g
49%
2,7 160 1340
2 200°C +100µm (d2)
43g
14%
1.0 250 510 6% 28% 3%
3 300°C -100µm (d1)
114g
46%
2,9 190 1080
3 300°C +100µm (d2)
46g
9%
0,7 240 370 4% 28% 2%
We can observe that silicon utilization of the fraction +100µm is significantly
different from an experiment to the other. It seems that the thermal treatment under
nitrogen has a negative impact on the silicon consumption rate. The higher
temperature the treatment is, the lower is the silicon consumption rate.
Qualitative SEM analysis illustrate this assumption: the silicon surface of fraction
+100µm is less consumed for treatment at higher temperature:
Figure 5:
SEM analysis of fraction +100µm after experiments with treatments under nitrogen
at 25, 200 and 300°C
Elemental analysis performed on each contact mass fraction give the concentration of
each element of the catalytic system. As no catalyst or cocatalyst was added together
with fresh silicon on day 2, catalysts measured on fraction + 100µm is exclusively
from transfer from activated particles from day 1 to fresh silicon. The transfer could
occur either during the treatment period (2 hours at fixed temperature under nitrogen)
or during the 7 hour reaction under methyl chloride.
Elemental analysis indicate that a low quantity of copper was transferred in the three
experiments. At the end of the second day, only 3 to 6 wt% of the copper initially
introduced in the reactor was present at the surface of the silicon particles from
fraction + 100µm.
132