


 144 / 390

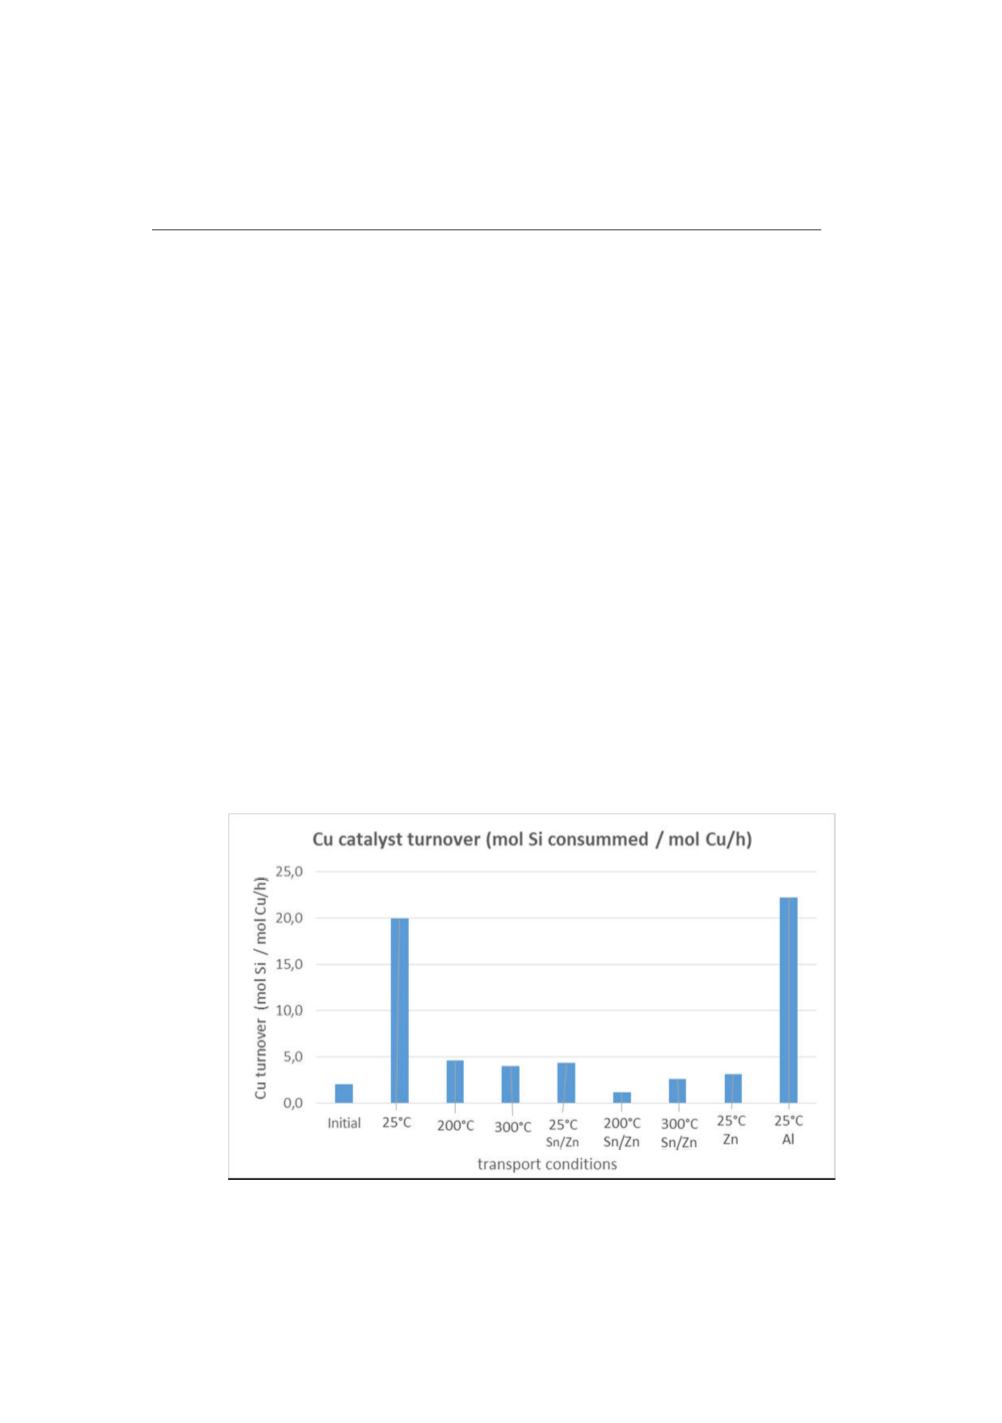
Table 5 :
Surface molar concentration of catalyst
Surface Catalyst concentration
Cu transfer
Exp Temp Cocatalyst Si Fraction
Cu
Sn
Zn
Cu
(°C) added
(day)
(mmol/m²) (µmol/m²) (µmol/m²)
(%)
Initial
/
-100µm (d1)
28,3
78
2607
1
25°C
/
+100µm (d2)
9,0
44
533
3
2
200°C
/
+100µm (d2)
15,0
198
747
6
3
300°C
/
+100µm (d2)
11,1
200
579
4
4
25°C
Sn+Zn +100µm (d2)
12,5
171
1223
7
5
200°C Sn+Zn +100µm (d2)
16,8
236
1269
5
6
300°C Sn+Zn +100µm (d2)
11,5
183
1464
5
7
25°C
Zn +100µm (d2)
12,9
116
2142
5
8
25°C
Al +100µm (d2)
7,1
66
564
3
Reactivity of copper transferred to fresh silicon was strongly affected by transfer
conditions and was systematically higher than the reactivity of the initial contact mass
(day 1). Reactivity of transferred catalyst could be up to 10 times higher than initial
reactivity.
The graph below represent the catalyst turnover (mol Si converted /(mol Cu.h) ) for
some of the experiments.
Figure 6:
Copper catalyst turnover for different transfer conditions
136