


 15 / 84

15
SAMC
o
T
• ANNUAL REPORT 2015
Monitoring of ice loads on the cofferdam of a fixed quay in
Kapp Amsterdam and the shore line in Svea Bay with load
cells (Geokon) was performed synchronously with water
level and ice temperature measurements. Both ice loads
on the cofferdam and ice loads on the shoreline show a
clear dependence on the phase of semidiurnal tide, but
the character of this dependence varies with the time.
The highest loads are observed during spring tides and
lowest during neap tides. The formation of ice loads on
the vessel rotates as a whole, together with the effective mooring line, around the elasticity center of
the mooring system. Tension of the mooring line reaches maximum at this stage. The characteristics of
the effective mooring line tension, typical times, and the spatial orientation of the vessel relative to drift
ice during the passive turn are discussed in the paper.
Merk
the shoreline is explained by the variable shape of the ice
across the fjord over the tidal cycle. Ice loads on the coffer-
dam of the fixed quay are created by the ice confined inside
the cofferdam. The origin of these loads is related to the
upward and downward migration of liquid brine through
the ice under the influence of tide-induced water pressure
below the ice, and brine freezing in the top layers of the
ice. This process is accompanied by an increase in the ice
temperature.
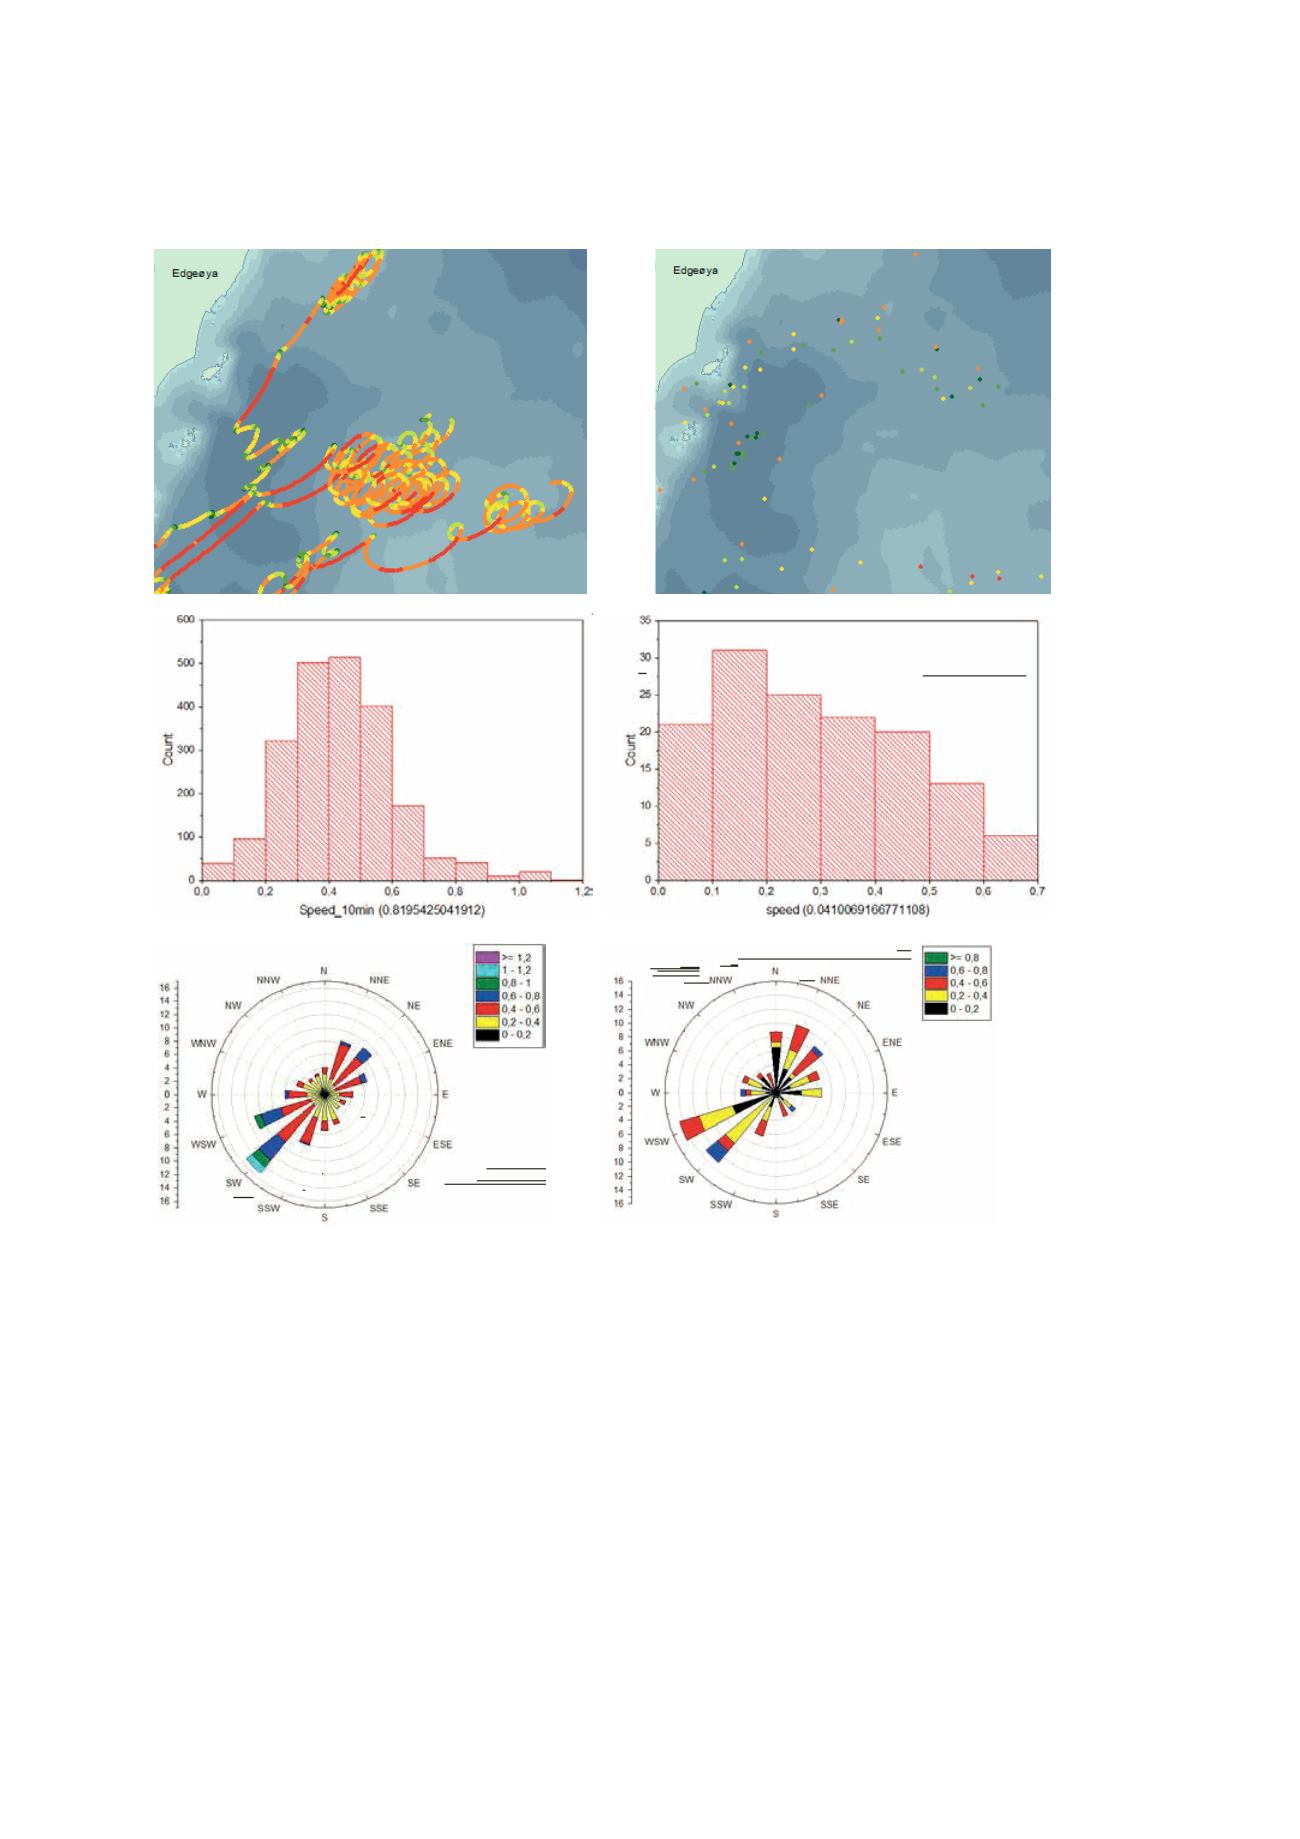
Figure WP1_6. Comparison of drift velocities calculated from ice trackers data collected with 20 min sampling interval (left columns)
and NOAA buoys data collected with sampling intervals 6 hours (right columns) in the Barents Sea Opening.