


 19 / 56

CenSES annual report 2014
19
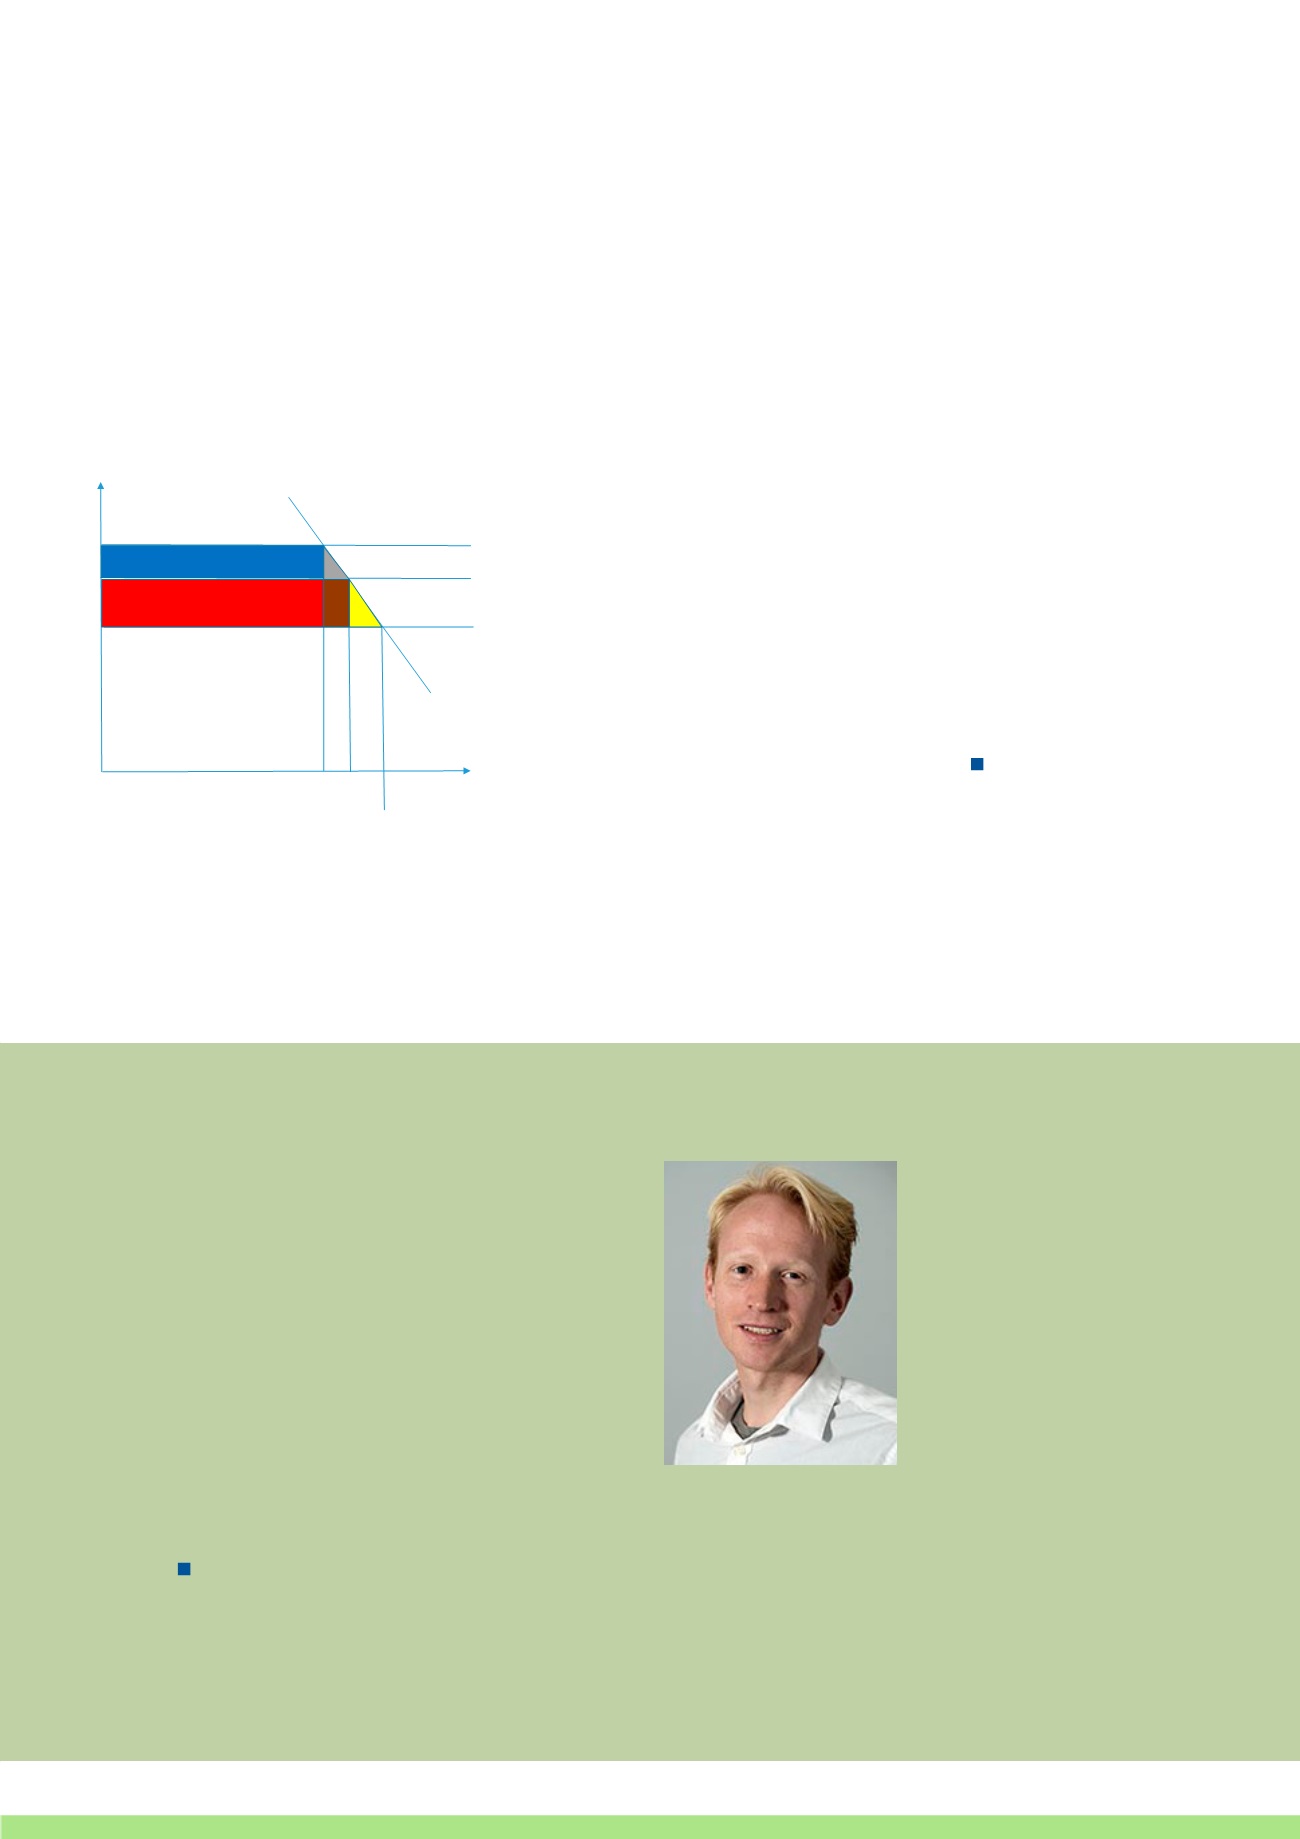
Figure 2 shows a stylized representation of welfare cost esti-
mates. It is not as if car buyers are viewed as being interested
in CO
2
intensity in itself, but rather that CO
2
intensity makes it
easier for car-makers to provide qualities users want: horse-
powers, size, etc. When raising the CO
2
related feebate by 50
percent, government revenue rises by D minus B, and the
welfare cost of the ten percent decarbonization is E. The study
draws in part on work done earlier in cooperation withTOI.
The study aims to recover how this transformation of the
vehicle eet is accomplished: to what extent are consumers
sacri cing qualities they cherish; to what extent are makers
pushed to provide these qualities by other means than
through CO
2
?
contractor can take steps such as getting panels professionally
inspected and visiting panel factories. In this way, contractors
can aggregate and control the risk of poor panel quality,
allowing for the large-scale use of Chinese-produced panels.
In turn, costs were reduced and adoption of panel systems
was increased.
These results have implications for understanding the rapidly
emerging solar power industry and in turn informing regu-
lations and public policy. For example, California’s subsidy
scheme for solar panels provided grants to investors of solar
power systems, but did not specify that the owner of the
solar panels also needed to be the home owner. This exibil-
ity allowed for the innovation of a leasing business model to
take hold.
The study accompanies broader studies along two lines.
In one, covering all transport, it is highlighted that each
‘vehicle mile’ – whether aviation, by ship, etc – can be decar-
bonized in ways such as these, but that other responses must
be allowed to accompany them. Some common features are
that decarbonization economies accompany:
• scale economies in‘vehicle size’: bus carbon-leaner than car
• capacity utilization: full car leaner than empty bus
• speed: slow movements leaner than fast
• hybridization: under variable loads, combined engine
con gurations leaner than singular.
In another, urban development and mobility is examined,
pushing the question of public transport’s relation to city size
and density. This study challenges conventional wisdom on
charging for emissions and congestion, showing that such
charges may have to be tailored not to block agglomeration
bene ts, especially in poor cities. The part of conventional
wisdom that is retained is dense development along high-
capacity transportation corridors.
gCO2/km
t=161 USD/g CO2/vkm
t=108 USD/g CO2/vkm
D
Marginal cost without CO2 cost
10%
CO2-tax kr/g/vkm
D
A
B
CO2-emission for cars that were chosen without CO2 tax
C
E
C
Post doc
Johannes Mauritzen
Figure 2