Basic HTML Version


34
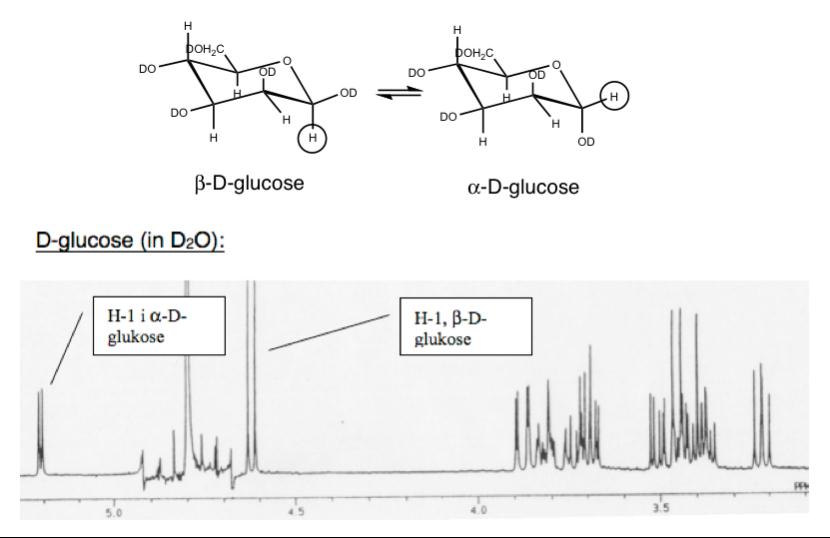
Figure 11.
1
H-NMR spectrum of D-glucose in D
2
O. Note that H-1 signals for
the two anomers are separated. The areal ratio between the two peaks
provide directly the molar
α
/
β
-ratio.
The anomeric protons (at C-1) are marked in the figure. D-glucose exists as
an equilibrium between
β
-
and
α
-D-glucose. In water we have about 70%
β
.
The H-1 proton in
α
-D-glucose gives a peak (doublet because of spin coupling
to H-2) at 5.2 ppm, whereas the
β
-form resonates at 4.6 ppm (also doublet).
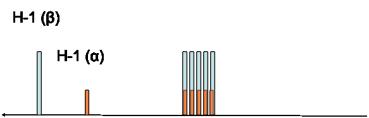
To simplify the picture we can use the following figure:
The
areas
under the peaks (determined by the NMR software) reflect the
30%/70% molar distribution (
β
/
α
). Thus, the area under each peak is
proportional to the relative molar ratio of the protons in question. This is the
basis for using NMR to find the sequence of alginates.
Note that the spin coupling constant (J) is different for
α
and
β
due to different
dihedral angles. It also distinguishes between different boat/chair forms, and
Figure 12. Simplified spectrum of D-glucose.