


 32 / 84

32
SAMC
o
T
• ANNUAL REPORT 2015
Ocean over six legs from 11th of January to 23rd of June
2015. Together they planned and carried out a program
from May 21st to June 23rd, four ice ridges were subjected
to morphology mapping and coring for mechanical and
physical properties in drift ice in the Arctic basin north of
Svalbard. The field campaign was part of amultidisciplinary
project organized and lead by the Norwegian Polar Institute
(NPI)
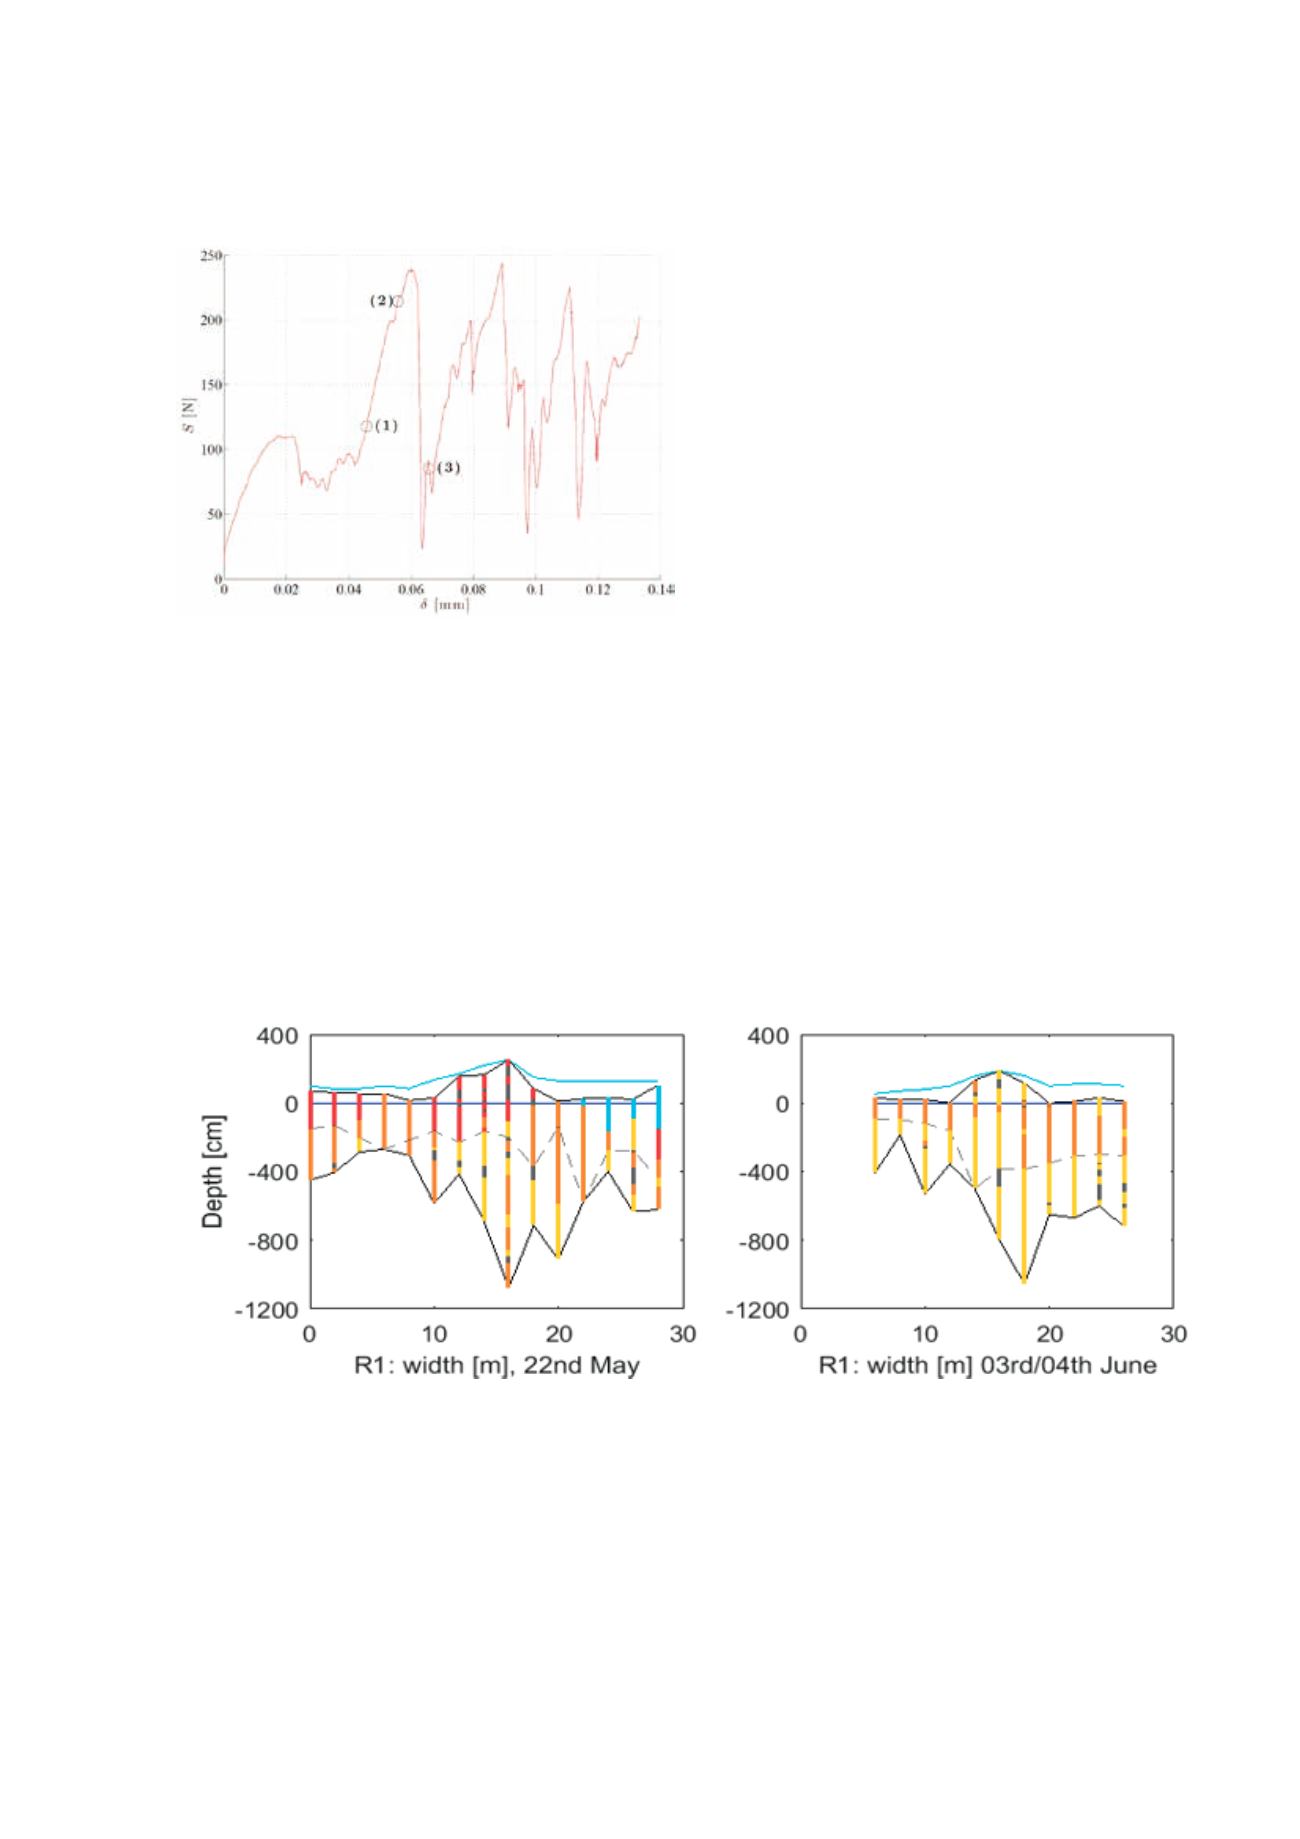
http://www.npolar.no/en/projects/n-ice2015.html.Ervik and Shestov investigated the consolidation, develop-
ment of porosity, keel depth and geometry and mechani-
cal properties of ridges. Thermistor-strings were deployed
through several ridges and monitored the internal temper-
atures. The investigation showed that while the rubble in
the lower part of the keel melted, the consolidated layer in
the upper part of the keel grew (Figure WP3_4).
They performed drillings through the ridges to establish
the macro porosity and cored ice samples that were tested
mechanically in KOMPIS, a portable device to measure
uni-axial compressive strength of ice (Figure WP3_5).
Simultaneously the rubble porosity decreased and the
strength of the consolidated layer and the sail decreased.
This shows that for ridge in their decay phase the consoli-
dated layer takes up a bigger portion of the total keel than
earlier in the ridge lifetime. The results further indicate
that the present ISO formulation for ice ridge action may
overestimate the ridge action from decaying ridges as its
mechanical strength is lower than earlier in the season,
even though the consolidated layer may be thicker.
In the autumn Åse continued her work on a continuum
based numerical model to simulate crushing of the consol-
idated layer and continued to identify events of ridge inter-
action with the Nordströmsgrund lighthouse (LOLEIF/
STRICE data).
Figure WP3_4 Ridge diagram
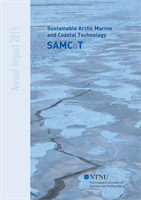
Figure WP3_3 shows force-time trace from the simulations
and illustrates the need for to use statistical tools to analyse
ice loads.