


 24 / 84

24
SAMC
o
T
• ANNUAL REPORT 2015
In addition, Kulyakhtin closely collaborates with ssistant
professor Polojärvi on how to determine stress-strain
relation from discrete element ice rubble bi-axial compres-
sion tests. Kulyakhtin and Polojärvi used the results of ice
rubble bi-axial test with the Aalto DEM model to investigate
how the stresses derived from the contact forces between
ice blocks converges as a function of averaging domain
size. Figure WP2_8 shows how the prediction improves
with increasing number of ice blocks.
Figure WP2_8 Converges of the horizontal (
xx
) and vertical (
yy
) stresses as a function of averaging domain size (
w
av
) over the
maximum dimension of ice blocks (
l
major
)
Further more, Pustogvar and Polojärvi are working
together to understand the relationship between linear and
volumetric porosity. Through DEM simulations of ice rubble
accumulation virtual linear porosity profiles are made and
compared with the volumetric porosity. This work will
constitute the final part of Pustogvar’s PhD and will be
completed early in 2016.
On a parallel research path, Sergey Kulyakhtin has
published a journal paper in Cold Regions Science and
Technology arguing that the volumetric behavior of ice
rubble is important. Data from literature on bi-axial
compression was re-analyzed through the concept of criti-
cal state soil mechanics, and clearly shows that by includ-
ing the volumetric component the precision in prediction of
properties increase substantially. Kulyakhtin has completed
his numerical continuum based FEM model for ice rubble
and validated it against measurements carried out in 2011
within the RITAS: EU HYDRALAB - IV Project “Rubble Ice
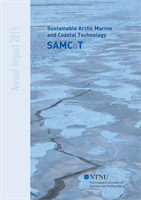
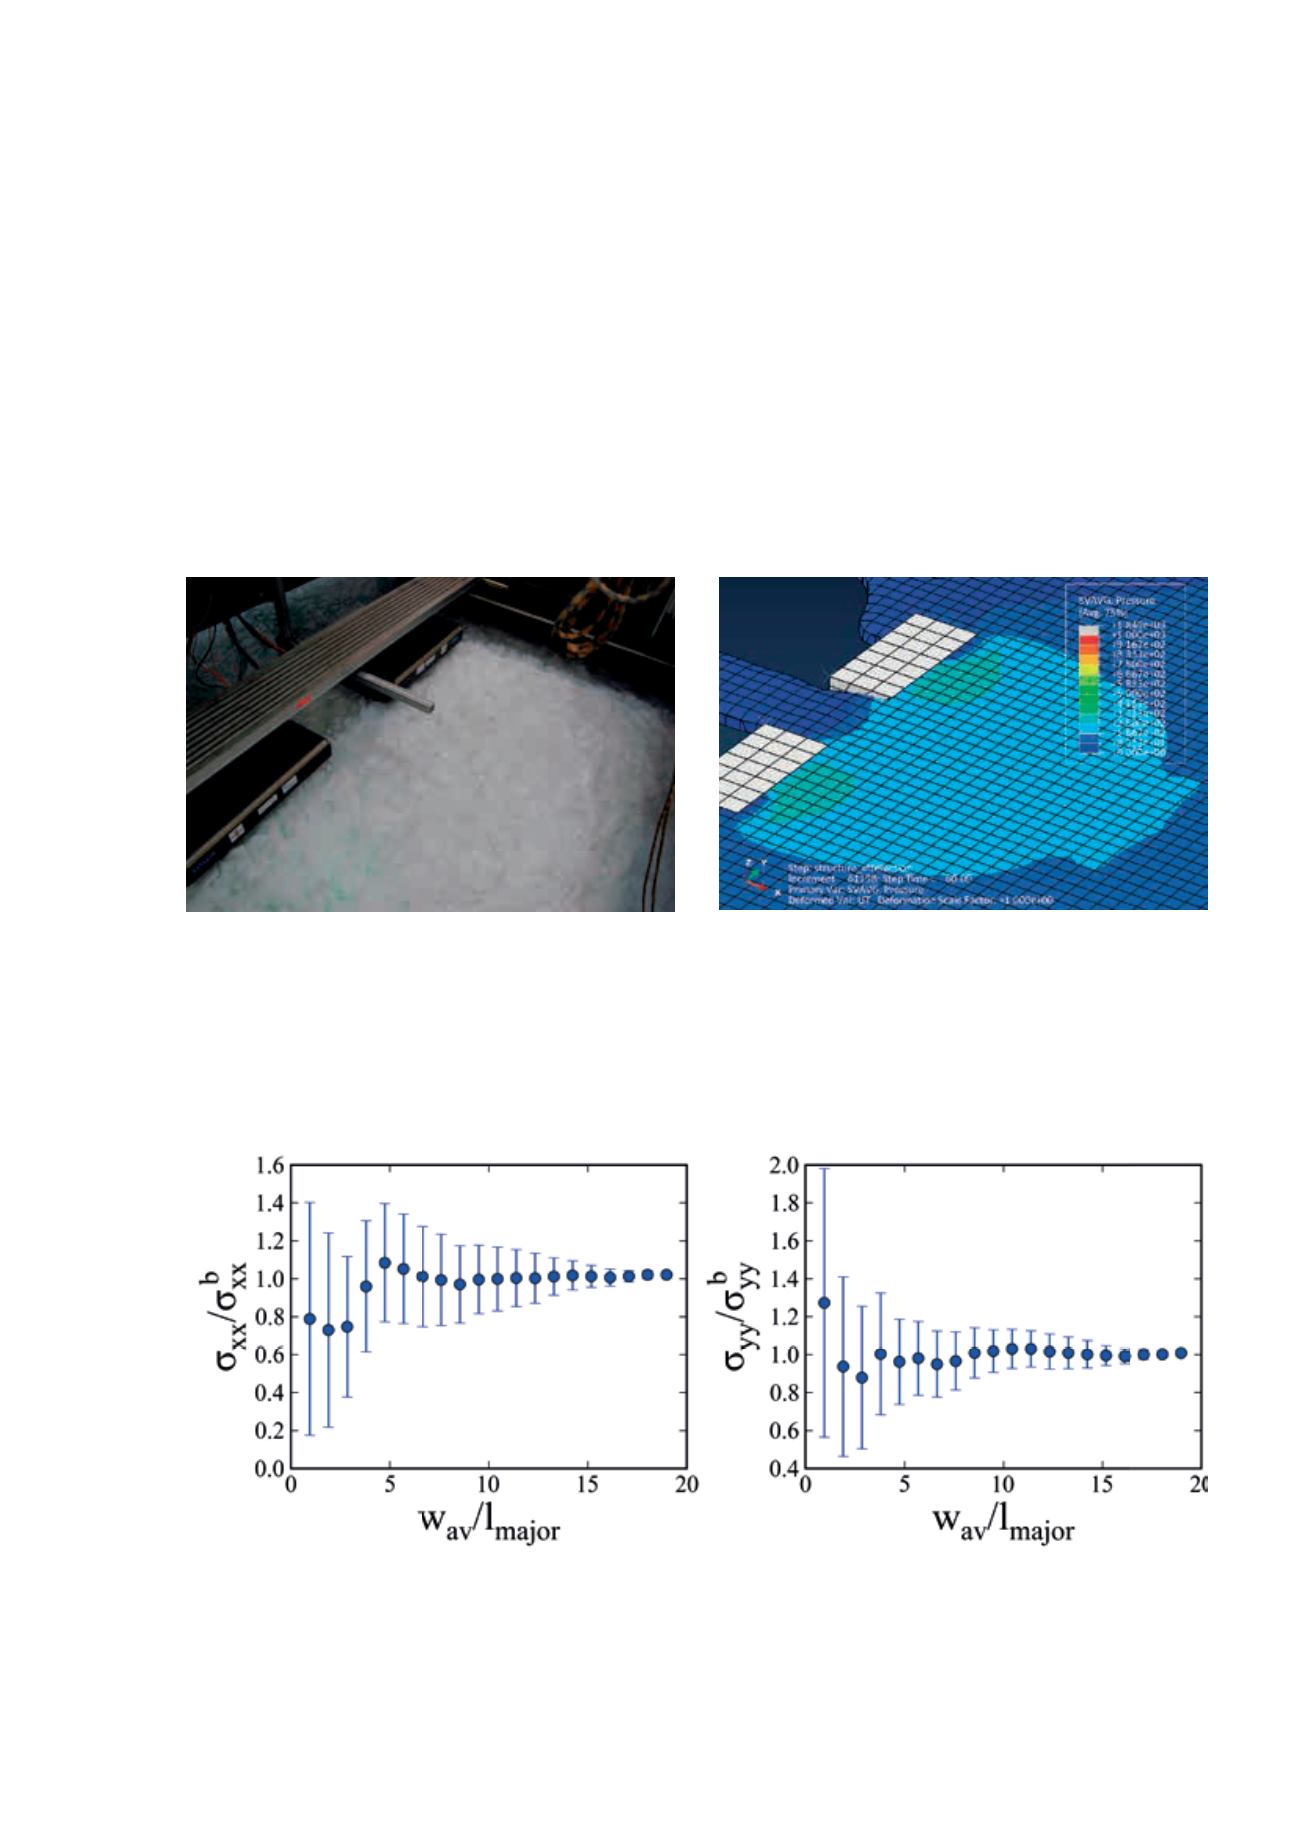
Transport on Arctic Structures” project. Figure WP2_6
shows photograph from the RITAs experiments and Figure
WP2_7 shows the numerical simulations of the same case.
The forces and rubble accumulation is well simulated.
Figure WP2_6 Picture from the ice rubble-structure inter-
action experiments (RITAS project)
Figure WP2_7 A snapshot from FE simulations of the RITAS
experiment shown in Figure WP2_6