Basic HTML Version


253
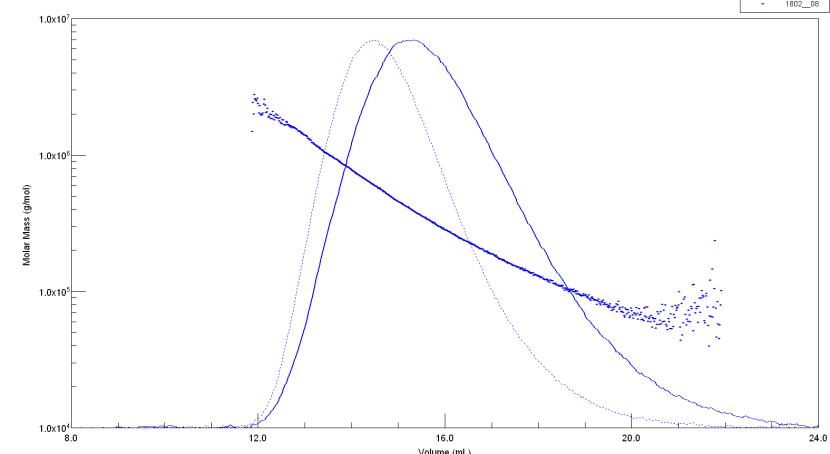
Figure: Solid line: RI signal (concentration). Dotted line: Light scattering signal at 90
°
. Symbols: M calculated for
each slice
This particular sample is a chitosan with M
w
of 320.000 Da. The figure shows
the largest molecules in the start of the peak are above 10
6
Da, and the
smallest are about 20.000 (by extrapolation of M-line to V = 24.0 ml).
The M-V data (note semi-logarithmic scale) corresponds to the ‘calibration’
line otherwise obtained using standards. However, the data were in this case
obtained by direct calculation.
No calibration of the M-V was needed because
light scattering and RI detectors were used
, and the calibration problems in
conventional SEC are avoided.
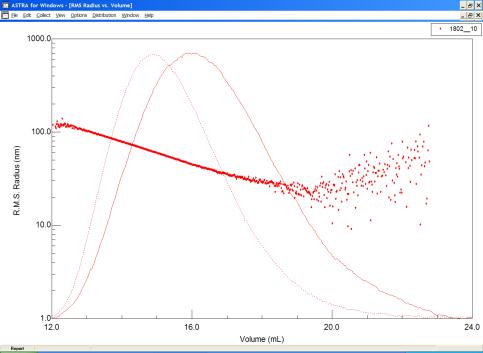
The plot of R
G,i
versus V (below) shows the largest molecules correspond to
R
G
= ca. 120 nm. We can follow the decrease in R
G
down to about 30 nm at V
= 19 ml. At higher volumes (lower M) we obtain mostly noise. Why? (Hint:
λ
).
Figure: RG (’radius of gyration’) data obtained for elution slices (same experiment as in Figure 3).