Basic HTML Version


130
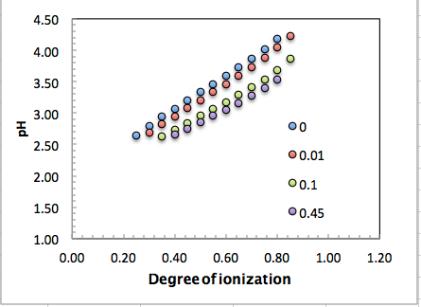
(Note: Only middle part of the titration curves shown, excluding the ‘dips’ at
the beginning and the end of the titration)
Based on the pH data the pK
a
values can then be calculated according to the
Henderson-Hasselbach equation:
pK
a
=
pH
−
log
α
1
−
α
As expected, pK
a
increases with increasing
α
as shown in the next figure
(below). Plots of pK
a
versus
α
are often linear and obey the Katchalsky
equation:
pK
app
=
pH
−
log
α
1
−
α
= pK
int
+
α
⋅Ψ
α
( )
pK
int
refers to the intrinsic pK
a
at the limit
α
= 0 (by extrapolation), i.e. in the
absence of charges.
Ψ
(
α
) can for practical reasons be treated as a constant.
The Katchalsky equation is useful to simply simulate and compare the titration
behaviour of a monomer (with a given pK
a
) and a polymer where pK
int
equals
the pK
a
of the monomer. In the figure below a simulation using pK
a
(monomer)
and pK
int
(polymer) of 4.76 (as in acetic acid).
Note the polyelectrolyte effects:
a)
The titration curve is steeper for the polymer
b)
The Katchalsky plot of the polymer has a positive slope: pK
app
increases with increasing ionization (for polyanions).