Basic HTML Version


127
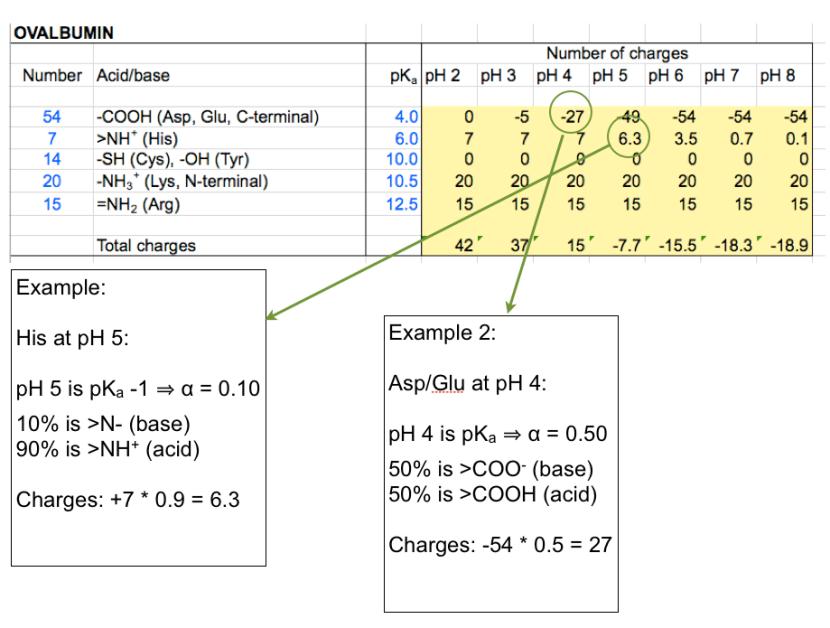
Summing up charges shows a transition from +15 at pH 4 to -7.7 at pH 5. The
isoelectric point must consequently be between these pH values.
In this example the pK
a
values were rounded off to some extent. More
accurate calculations may be obtained using more precise values, and also
using the exact solution to the HH equation, and finally by repeating the
procedure using a more narrow pH interval.
3.1.9. Acid-‐base
titrations of polyelectrolytes: pK
a
depends on
the degree of
ionization
Polyelectrolytes behave differently from small molecules when it comes to
acid base titration. A simple acid such as acetic acid (CH
3
COOH) has a well-
defined titration curve and a unique pK
a
(4.76). The Henderson-Hasselbach
plot (pK
a
as a function of
α
) is simply a horizontal line (below, right):