
32
Annual Report 2016
SAMCoT
The Aalto University ice mechanics group has continued
with their research on numerical modelling of sea ice
mechanics. PhD candidate Janne Ranta has progressed
with the research for his doctoral thesis on the statis-
tics (and the mechanics behind the statistics) of ice
loads. The approach is unique as the ice load statistics
are based on the FEM-DEM simulations of ice-structure
interaction processes. Ranta prepared three draft
manuscripts for journal articles during 2016. All three
manuscripts have now been submitted, and one of them
was published late last year in the journal Cold Regions
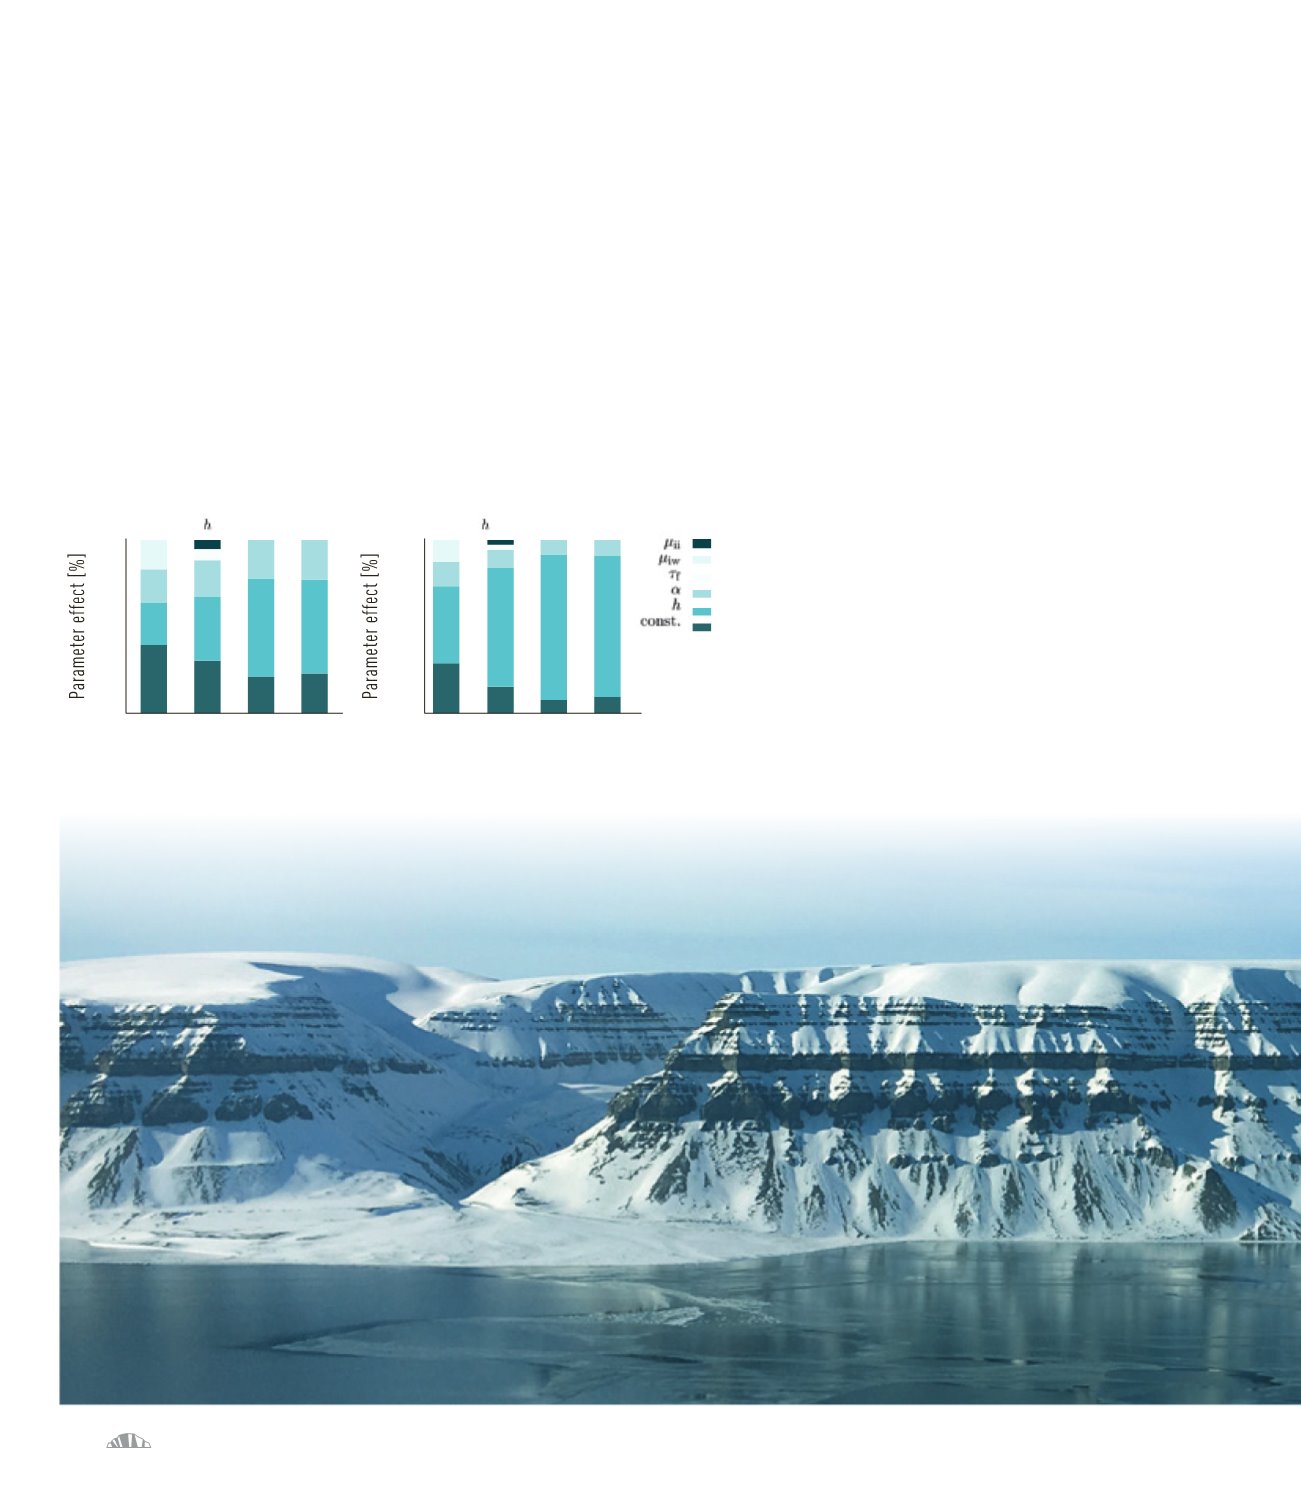
Science and Technology. This paper analyses peak ice
load data from 2D combined nite-discrete element
NUMERICAL MODELLING OF SEA ICE MECHANICS
method simulations. In these simulations, an initially
continuous ice sheet, modelled as a oating beam,
breaks into smaller ice blocks as the sheet is pushed
against an inclined structure. Multivariate linear re-
gression modelling and the variable elimination method
were used in the analysis of the data. The analysis gave
valuable insight into the peak ice load data in a si-
mulated ice-structure interaction process. It was found
that the peak ice load data can be estimated with good
accuracy using only ve parameters: the ice thickness;
the inclination angle of the structure; the shear strength
of ice; the ice-structure and ice-ice friction coefficients.
The ice thickness and the structure’s inclination angle
had the strongest relative effects, with their importance
changing during the process. The results also showed
that the stage of the ice-structure interaction process
should be taken into account in ice load models. The
results underline the importance of statistical analysis
of ice load data and give valuable suggestions for future
work. Associate professor Arttu Polojärvi and Professor
Jukka Tuhkuri both actively participated in the research
leading to these manuscripts. Additionally, the group
presented two papers at the IAHR ice symposium last
summer. One of the papers was related to the statistics
of ice loads, while the other focused on a study on ice
loads on shallow water structures.
100
80
60
40
20
0
1
2
3
4
1
2
3
4
100
80
60
40
20
0
Region
Region
= 0.5 m
= 0.25 m
The relative effects of ice thickness (h), inclination angle
(
α
), shear strength (
τ
f
), ice-structure friction coefficient
(
µ i
v
), and ice-ice friction coefficient (
µ ii
) on peak ice
loads. The left graph shows the effects when
h
= 0.5 m
and the right graph when
h
= 1.25 m. Other parameters
had fixed values:
α
= 70
◦
,
τf
= 0.4 MPa,
µ iw
= 0.1,
and
µii
=0. 3.


