Basic HTML Version


246
Molecules which are too large to penetrate into the pores, are excluded. Their
elution volume corresponds to the volume between the particles, usually
referred to as the ’void’ volume (V
0
). Conversely, molecules that freely enter
the pores will have an elution volume of V
0
+ V
P
= V
T
(total volume), where V
P
is the pore volume. Between V
0
and V
T
molecules of intermediate size elute
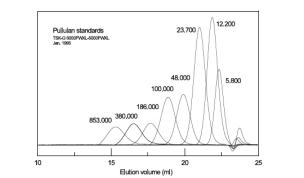
according to the decrease in molecular size. The figure below shows a series
of elution profiles (concentration profiles detected at the column outlet using a
concentration-sensitive on-line detector) for a series of essentially
monodisperse pullulan standards.
In this case a refractive index detector was used to monitor the separation.
Sometimes UV or fluorescence detectors can be used.
6.3.3. SEC
calibration
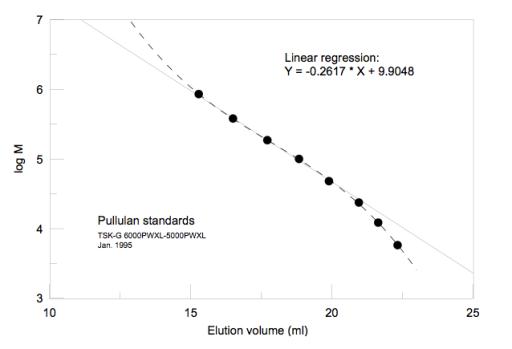
It is clearly seen from the figure above that the elution volume increases as
the molecular weight decreases, as expected from the mechanisms just
described. By recording the elution volumes a calibration curve, i.e. at plot of
log M as a function of V can be constructed: