Basic HTML Version


210
5.3.2. Example: Analysis of a polysaccharide degradation
experiment:
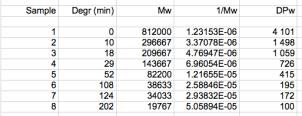
An alginate was hydrolysed at 100
°
C at pH 5.6. Samples were taken at
different intervals and M
w
was determined. Results:
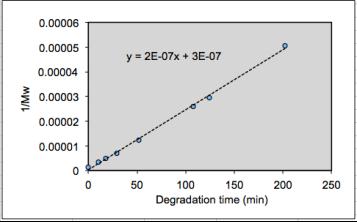
To further analyse the data a plot of 1/M
w
versus degradation time (t) is made:
The data for 1/M
w
fall in a perfectly straight line according to the equations
above. Hence, the degradation is random. A linear regression analysis gives a
slope of 2.42E-7, corresponding to a rate constant (using M
0
= 198 for
alginate) of 6.1E-10 min
-1
.
5.3.3. Towards
the oligomer
range: Higher
α
values
If we degrade to larger
α
values, i.e. approaching the oligomer range, the
approximation
ln 1
−
α
(
)
≈ −
α
no longer holds, and the
ln 1
−
α
(
)
term cannot
be simplified. Hence: