Basic HTML Version


203
T (K) k
T
1
k
1
T
2
k
2
..
..
The activation energy can be determined by simply fitting the k-T data to an
exponential function. The classical analysis is, however, to apply a logarithmic
approach since:
ln
k
=
ln
A
−
E
A
RT
=
ln
A
−
E
A
R
⎛
⎝⎜
⎞
⎠⎟
1
T
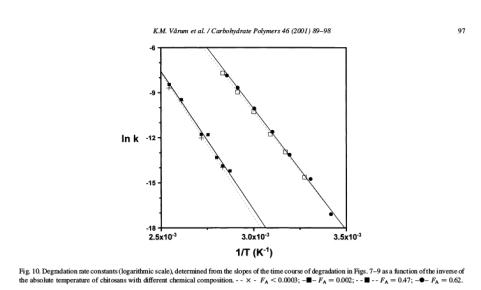
Thus, a plot of ln k as a function of (1/T) should give a straight line with slope
equal to (-E
A
/RT) and ln A as intercept. Here is an example of an Arrhenius
plot for hydrolysis of four different
chitosans
:
The data fit very well to the Arrhenius equation, and from the slopes the
following activation energies were found: