Basic HTML Version


12
Rich Pressure, Poor Ecosystems
- by Edgar Hertwich
RESEARCH
I just returned from my weekly trip to the
supermarket: in addition to Kenyan roses,
Brazilian melons, Israeli oranges, Dutch
tomatoes, kiwis from New Zealand, and
potatoes from Saudi Arabia (!), I have, for
the first time, found minced beef from
Botswana, sold for just over half the price
of the Norwegian one. We have over the
years become accustomed to the increas-
ing variety and prettiness of food we find
on supermarket shelves, regardless of the
season. Meanwhile, we are generally ob-
livious to the ecological cost of this bounty.
New scientific research now shows that,
indeed, consumers in some rich countries
live well above their ecological means and
in the process threaten global biodiversity
(see also previous post). They can do so only
because of international trade.
The increasing intensity and extent of hu-
man land use is a major threat to ecosys-
tems. Estimates by the Gobal Footprint
Network show that humanity already uses
two thirds of the fertile land available on
this planet; calculations by the Institute of
Social Ecology in Vienna demonstrate that
humans in fact appropriate a full quarter of
terrestrial biomass. According to the Millen-
nium Ecosystem Assessment, habitat loss
– mostly through land use – is the number
reason for the extinction of species on the
planet. Climate change, hunting and fish-
ing, the release of nitrogen and phosphorus
– in large part due to fertilizers used in ag-
riculture, and alien species also contribute
significantly to the largest mass extinction
event since the disappearance of the dino-
saurs.
In the most encompassing and detailed
study of the processing, trade and con-
sumption of products of land use, we
quantify the land footprint of 87 individual
countries and 26 more aggregate regions,
covering the entire global economy. We ex-
press land use in terms of hectares of global
average crop land productivity, the meas-
ure of the well-established Ecological Foot-
print. Our analysis shows that the land foot-
print for different countries can be largely
explained by only two factors: wealth and
the availability of fertile land. Richer coun-
tries have a higher footprint: the per capita
footprint of Germany and France in 2004
was 2.7 global hectares per person, China’s
0.8 and India’s only 0.6 gha/p. At the same
time, countries with a lot of land available
use more of it; Canada’s land footprint at
3.9 gha/p was much large than Japan’s (2.0
gha/p); Brazil used 2.3 gha/p, while Bulgaria
with the same GDP per person used only 1.7
gha/p. (If you want to know your country’s
footprint, see our visualization.) Through-
out our dataset, a doubling of per capita in-
come increases the footprint by 35%; while
a doubling of domestic land availability in-
creases the footprint by 23%.
You are forgiven to think that, well, overall,
this is not so surprising. The study, in the
meantime, resolves a scientific mystery. If
you measure biomass use in different coun-
tries, as the aforementioned Institute of
Social Ecology has done, it varies a lot but
does not depend much on wealth. If you
look historically at biomass use per capita,
it has gone down instead of up (see meta-
bolic rate). This trend is contrary to the ob-
servation for food consumption, which in-
creases with increasing wealth; just witness
the present obesity epidemic. The explana-
tion, in our eyes, lies in the displaced land
use which was not fully considered in the
work of the colleagues from the Institute
for Social Ecology. Displaced land use, in
fact, increases proportional to income per
capita and does not depend at all on the
domestic availability of land. The replace-
ment of draught animals and fire wood by
fossil fuels probably also plays a role for the
historical development.
Paradoxically, the beef from Botswana I
found in the supermarket today is a success
for Friends of the Earth and other green
and development groups who have long
lobbied for a greater access of develop-
ing countries’ agricultural products to the
markets of the rich world. We have not in-
vestigated whether the ecological impact
of beef production in Botswana is higher
or lower than in Norway. Looking just at a
package of minced meat, it may be a good
thing, not least because it provides in-
come to a relatively poor population. The
problem is that international trade moves
the ecological impact out of our sight.
Ecological limits disappear. Our results show
that Japan and South Korea displace twice
as much land use as they have fertile land
available domestically. Also in Europe, we
live above our biocapacity: Germany’s land
footprint is 30% higher than the amount of
fertile land available, the land footprint of
the Netherlands and Belgium is two and a
half times their biocapacity.
Our study indicates that as emerging
economies get richer and the population
grows further, nature will be squeezed. By
2050, basically all available fertile land will
be used to satisfy increased consumption
levels of a larger population. Some relief for
nature may come from an intensification of
land use and an increase of fertile land area
through irrigation. At the same time, cli-
mate change, erosion, salinization of soils as
a result of irrigation, and urbanization will
reduce the available fertile land. Reduced
biodiversity will make us more vulnerable
to pests. Given the systematic net displace-
ment from rich to poor countries, we can
expect that biodiversity will be especially
threatened in those remaining poor coun-
tries which have underdeveloped institu-
tions and hence no capacity to protect bio-
diversity.
None of this is inevitable; we can reduce
our land footprints by reducing the over-
consumption and waste of calories, limiting
the consumption of animal products which
already cause 28% of global land use, pre-
serve forests and avoid sealing too many
surfaces. Avoiding a further squeeze of
poor countries’ ecosystems requires chang-
ing the current global land use pattern that
has been identified in our research. Displac-
ing land use to poor countries makes us co-
responsible for protecting their biodiversi-
ty, and mechanisms need to be developed
for doing so.
Contact person: Professor Edgar Hertwich,
edgar.hertwich@ntnu.no
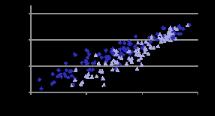
Figure: Land use embodied in imports of different countries as a function of the countries’ income per
capita. Each symbol is a country, and each country appears twice; dark diamonds reflecting nominal
GDP, triangles for purchasing power parity corrected GDP. (carbonfootprintofnations.com)