Assessing aortic stenosis severity by ultrasound
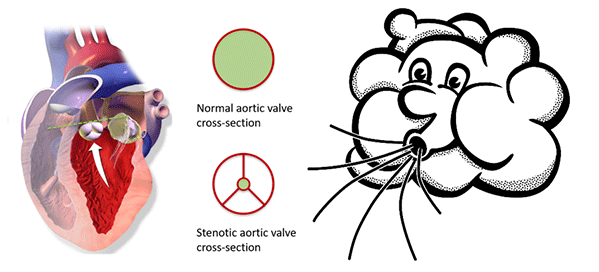
Aortic valve stenosis is a narrowing of the valve that separates the left ventricle from the aorta. A reduced opening increases the effort required by the left ventricle to pump blood. Being a degenerative disease, patients with aortic stenosis must undergo a clinical follow-up, which is usually performed by ultrasound. At the Centre for Innovative Ultrasound Solutions (CIUS), we are developing a new method that exploits 3-D high frame-rate imaging to increase the degree of automation in aortic stenosis flow measurements. The goal is to speed up the workflow in the clinics and increase the accuracy of measurements.

Assessment of aortic stenosis severity by ultrasound
The effect of a narrowing on blood flow is straightforward. The smaller the opening, the faster the blood travels through it. In fact, an important marker used in aortic valve stenosis assessment is the maximum blood speed (velocity) through the aortic valve. Velocities > 4 m/s indicate a severe stenosis and that the patient may need a valve replacement soon. A severe aortic stenosis with symptoms or reduced cardiac function are the main indications for valve intervention (also see this previous blog about aortic valve stenosis – in Norwegian).
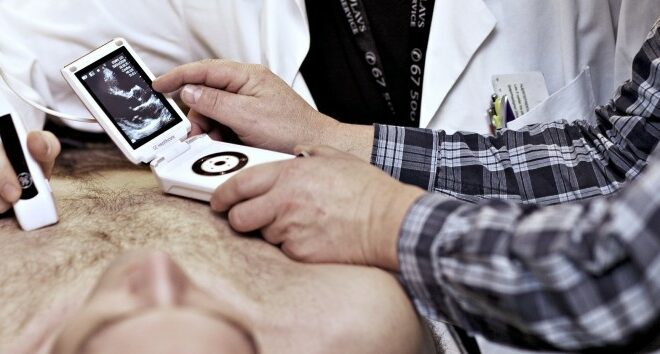
Ultrasound is used to estimate blood velocities in several clinical applications, including aortic stenosis assessment. Measurement are performed by exploiting the the Doppler Effect. We experience this phenomenon every time we perceive a shift in the siren’s pitch as an ambulance is driving towards or away from us.
Unfortunately, there is a major challenge that cardiologists must face when using Doppler Ultrasound: if the cardiologist fails to align the probe with the aortic flow, the maximum velocity is underestimated, potentially leading to a wrong diagnosis. For this reason clinical examinations often take several minutes and the quality of the diagnosis is highly dependent on the cardiologist’s skills.

Towards automatic aortic jet direction estimation
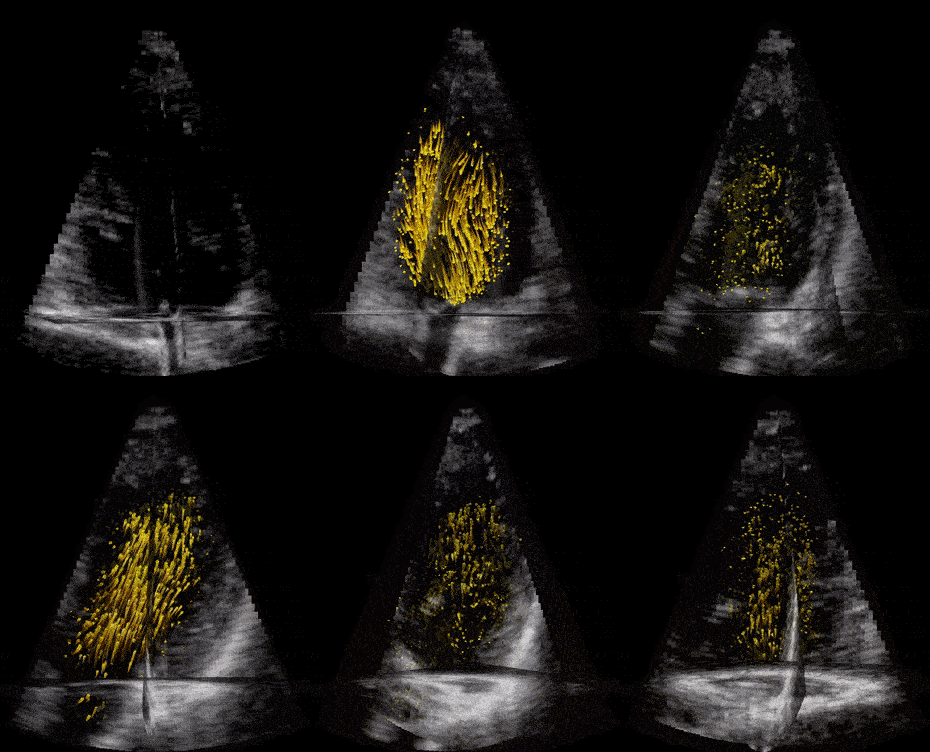
As explained by my colleague Morten Smedsrud Wigen in a previous post, new imaging techinques allow us to record the blood signal arising from a volume with really high frame rates, which can be combined with algorithms that trace the motion of blood. Our goal is to apply the same method to automatically estimate the direction of aortic jets, and use this information to compensate for the above-mentioned effects of misalignment when measuring blood velocities with Doppler ultrasound, reducing the risks of user mistakes and speeding up the examination process.
Results from simulations show that it is possible to estimate the aortic flow direction with good accuracy, provided that the signal is strong enough. However, the method eventually does not work for high degrees of misalignment or low signal levels. A small pilot study on 12 patients showed that while misalignment is hardly an issue, low signal levels are a source of concern. An ongoing clinical feasibility study will provide valuable information to improve both the algorithm and the acquisition set-up.

Stefano Fiorentini
- This author does not have any more posts.


