Automatic lung cancer staging using CT data
For patients suffering from lung cancer, the diagnosis phase is crucial in order to select the best course of action and predict both outcome and survival expectancy. At the same time, the diagnosis is solely based on one CT data and relies heavily on the expertise of the radiologist and the quality of the data.
As lung cancer primarily manifests itself through large tumours within the lungs themselves, it is relatively easy to detect them with a regular CT-scan. However, as the cancer spreads, it will reach the surrounding lymph nodes, causing them to metastasise and grow in size. The challenge thus becomes to accurately identify such lymph nodes, determine their size, and their exact anatomical location. Based on the location of the affected lymph nodes, the surgeon will decide whether the patient can undergo surgery or not. In order to assist the medical team in making the best diagnosis, we propose to develop an automatic lymph node detection and anatomical location assignment tool.
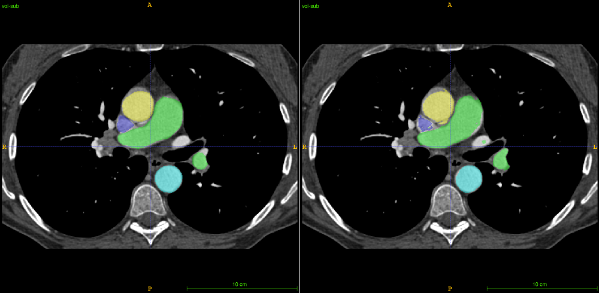
Lymph nodes are small anatomical structures naturally located in between other organs in the body (e.g. the lungs, heart, pulmonary trunk, etc.). The first step of our tool is therefore to reduce the amount of data that needs to be analysed further, by removing nearby organs. To do this, we opted for a multiple CT volume registration using CT data from 10 different patients as reference. In each, we manually traced the position of all the relevant organs, and filled each with a different colour. Each of the 10 CTs is automatically aligned with the CT of the patient to be diagnosed, providing a corresponding colour map at the same time, i.e. an estimate of the organs location. To smooth the results, an averaging of the 10 colour maps is performed to produce one final organ location estimation (see Figure 1).

Within CT data, each anatomical substance possesses a different radio-density, which means different pixel values. In other words, air will, for example, be represented by a colour close to black (- 1000 HU) whereas bones represent the other side of the scale with a colour close to white (+ 1000 HU). In between those two extremities, lymph nodes are often represented with values ranging from 0 to 300. When imaging cancerous lymph nodes, the value reflects the aggressiveness of the cancer. The more aggressive, the higher the value.
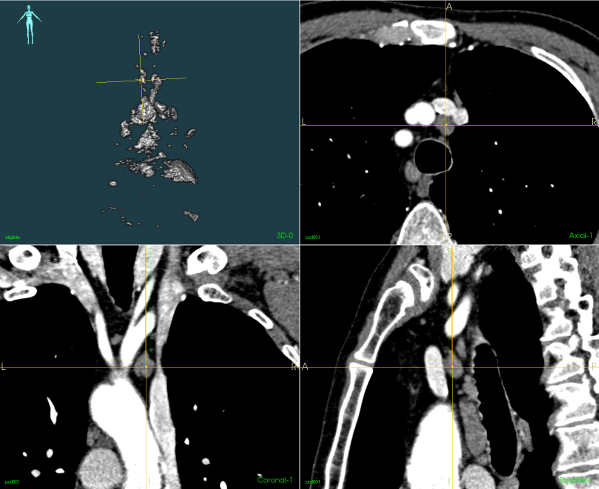
Using image-processing techniques it is then possible to reduce the number of regions to analyse by excluding areas where the value does not fit our range, and areas where other organs have been identified. The upper-left image in Figure 2 shows the remaining regions before undergoing the classification step. The three other sub-images of Figure 2 show different 2D CT views centred on the yellow marker 3D location, which is pointing towards a cancerous lymph node in this case. The remaining regions are then sorted using classification techniques to further reduce the list of potentially cancerous lymph nodes.

Finally, all the regions classified as being possible lymph nodes are associated with a region label using the same registration strategy as used in step one. Ranked according to their length and width, a final and exhaustive list of lymph node candidates is then produced to help make the diagnosis.
Upon completion, our tool could easily be made available to clinicians through the software platform CustusX, but only as a research component and not yet as part of the regular clinical workflow.
The second stage in the clinical diagnosis consists of doing biopsies of the lymph nodes, which appear to be malignant on the CT data before planning the surgery. As such, a long-term plan would be for our tool to also contribute during the biopsy procedure. An ultrasound probe is inserted through the trachea to get a real-time view of the anatomy from the inside. The probe is coupled with an electromagnetic tracking system to know its relative position continuously, and preoperative models are merged to enable better control over the lymph node sampling.
By doing so, it would be possible to match lymph nodes detected via the ultrasound probe with pre-detected lymph nodes from the CT data. The CT data would be providing a global referential, as opposed to ultrasound only providing very localized data, thereby helping the surgeon to accurately sample all the required lymph nodes.
The project is a collaboration between St. Olavs, NTNU, and SINTEF.

David Bouget
Research Scientist, SINTEF, 2019-
PostDoc, CIUS, 2016-2020
- This author does not have any more posts.


